Market Snapshot
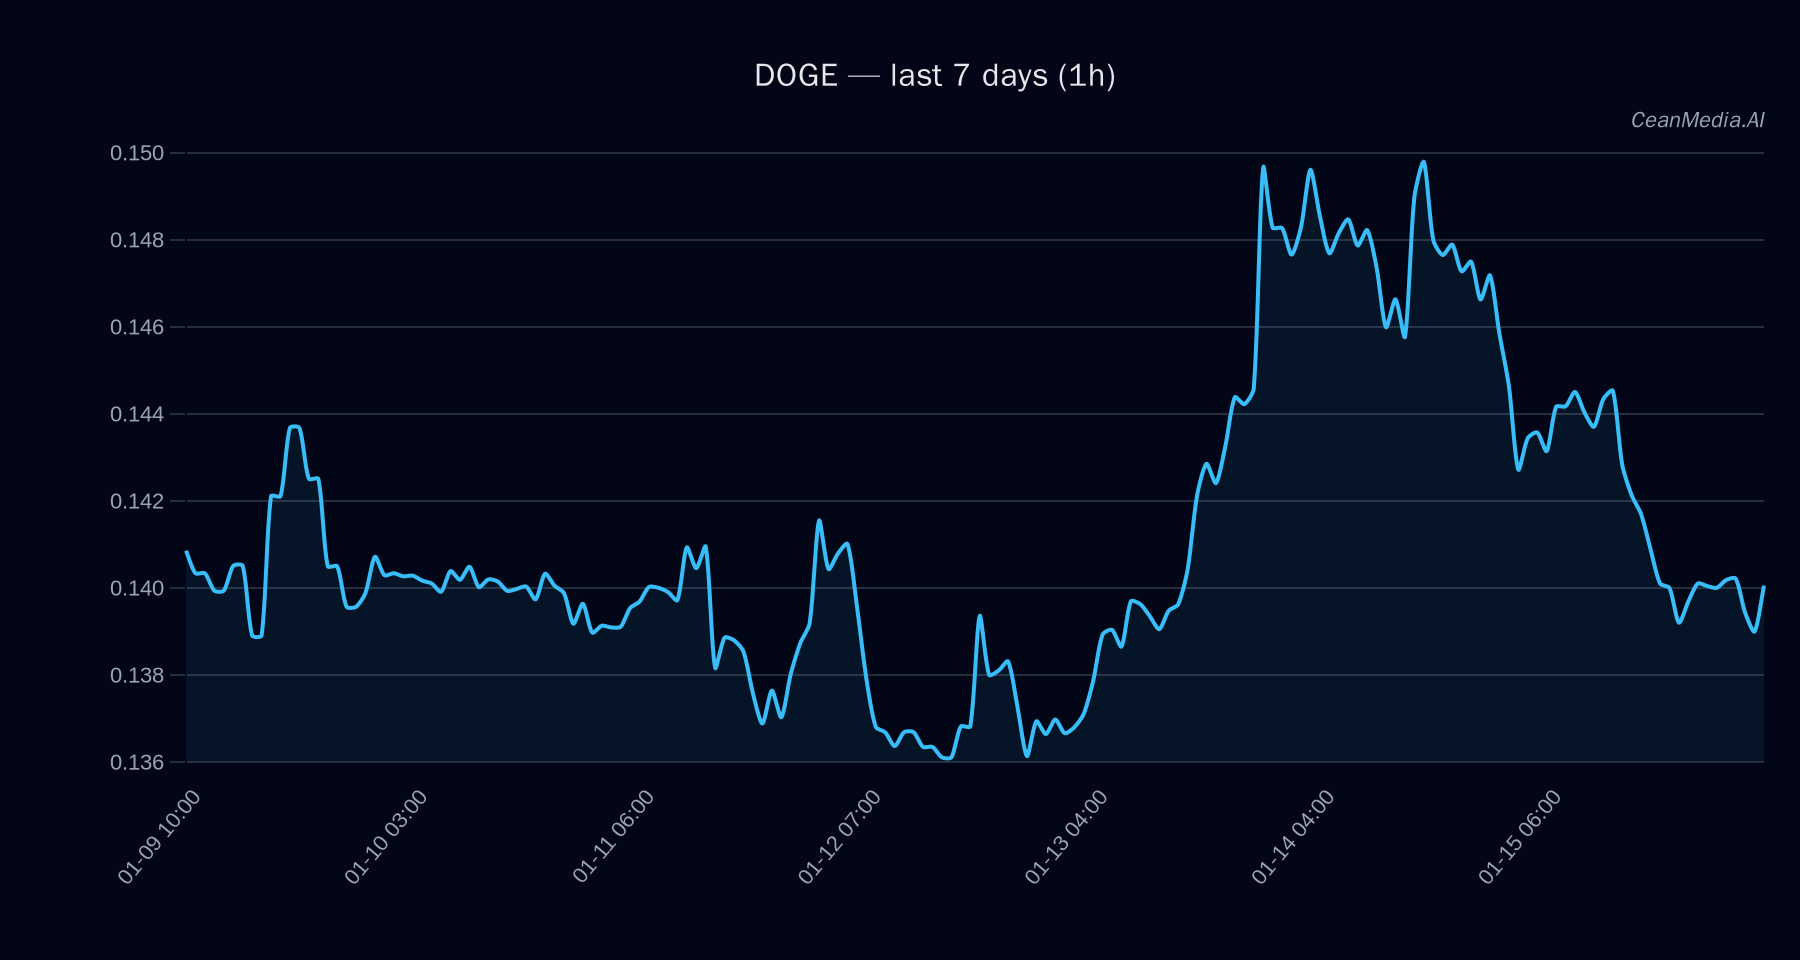
On January 16, 2026, Dogecoin (DOGE) is trading around 0.1402 USD. The market exhibits very low volatility with a recent 24-hour return of approximately -2%. Broad market sentiment remains neutral, with no significant directional bias evident from the recent technical and fundamental indicators.
Technical Analysis: DOGE
DOGE is currently positioned between key support at 0.135 USD and resistance at 0.145 USD. The short-term forecast indicates a 50% probability of a downward move, with a potential break below support targeting levels near 0.1319 USD, or an upward move beyond resistance toward approximately 0.1488 USD. The technical indicators suggest a sideways bias:
- EMA12 is below EMA26, indicating short-term bearish momentum.
- SMA50 remains above SMA200, hinting at longer-term stability.
- RSI stands at 41, reflecting neutral momentum.
- Volatility remains very low at 0.45%, supporting a consolidation phase.
> Invalidation of the current sideways bias would occur if the price breaks convincingly above 0.145 USD, while a sustained move below 0.135 USD would confirm further downside potential.
Drivers
The primary factors influencing DOGE include:
- Recent 24-hour return at -2%, indicating minor short-term weakness.
- EMA slope remains slightly negative, reinforcing the sideways to bearish outlook.
- Funding Z-score at -1.16 and BASIS Z-score at -0.45 suggest limited speculative excess.
- Order-book imbalance is minimal, indicating balanced buying and selling interest.
- Bitcoin’s 24-hour return is slightly negative at -0.79%, with a neutral trend strength, reflecting subdued crypto-wide momentum.
>The overall momentum remains muted, with volatility regimes indicating low risk and subdued market activity.
ETF Flows (BTC/ETH)
Recent ETF flow data for Bitcoin and Ethereum provides context rather than direct signals for DOGE. Bitcoin ETFs experienced a net outflow of approximately 26.7 million USD over a single day, but accumulated inflows over the past 5 and 10 days totaling +659.7 million USD and +700.1 million USD respectively. Conversely, ETH ETFs saw inflows of +15.2 million USD on the day, with more substantial inflows over 5 and 10 days (+91.7 million USD and +289.8 million USD). This suggests a nuanced risk-on environment, with increased institutional interest in ETH and mixed signals for BTC, indicating cautious but ongoing market participation in the broader crypto space.
What to Watch Next
- Monitor if DOGE breaks above 0.145 USD for a potential bullish move toward 0.1488 USD.
- Watch for a sustained move below 0.135 USD to confirm further downside risk.
- Observe broader market flows, especially ETH ETF inflows, as a gauge of risk sentiment.
- Keep an eye on Bitcoin’s recent outflows and trend strength for overall market direction clues.
Note: ETF flows are specific to BTC and ETH and serve as market context; they are not primary signals for DOGE trading decisions.
Hashtags: #Dogecoin #CryptoAnalysis #MarketUpdate #BTC #ETH #ETFFlows #TechnicalAnalysis #CryptoTrends #Altcoins #MarketSentiment #CryptoInvesting #FinancialAnalysis