Market Snapshot
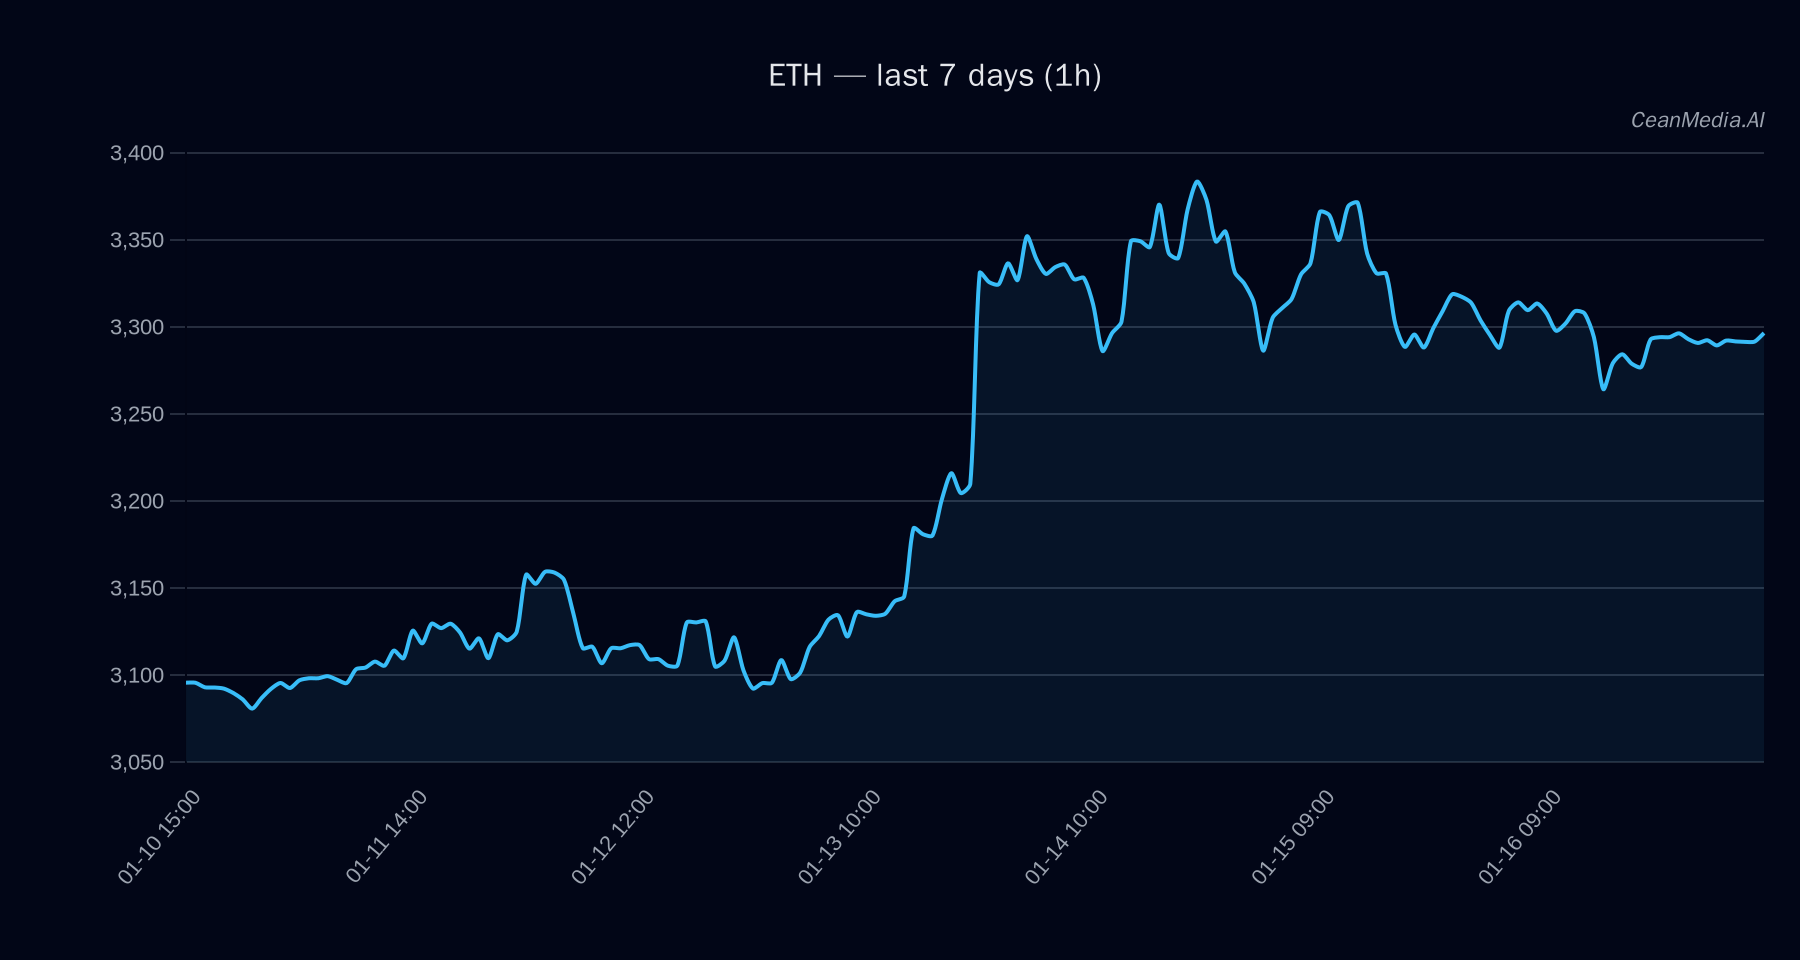
As of January 17, 2026, ETH is trading around $3,300 with a sideways bias. The current market environment exhibits very low volatility, with a neutral RSI of 53 and technical indicators suggesting equilibrium between bullish and bearish pressures. Notably, Bitcoin’s dominance remains elevated at 57.4%, gaining 0.5% over the past week, while ETF flows show mixed signals, with ETH experiencing inflows over the last 5 and 10 days despite a recent decline in short-term ETF holdings.
Technical Analysis: ETH
- Key Levels: Support at approximately $3,234; resistance at around $3,366.
- Bias: Sideways with a slight downward tilt, as EMA12 is below EMA26 and the SMA50 remains above SMA200.
- Triggers: A close above $3,366 could target $3,434–$3,501; a close below $3,234 could lead to a decline towards $3,170–$3,105.
- Invalidation: Break below support of $3,234 invalidates the current sideways bias and suggests further downside.
- Indicators: RSI is neutral at 53; volatility remains very low, indicating limited short-term price movement.
Drivers
- Top Factors: Slight positive EMA slope (0.0002), moderate funding Z-score (0.47), and basis Z-score (0.82) support stability.
- Momentum & Volatility: Return over 24 hours is nearly flat (-0.0051), with low volatility regime and minimal spread (0.03 basis points).
- Market Sentiment: Market breadth remains balanced at around 50%, with Bitcoin’s dominance slightly increasing, and positive ETF flows over the last 5 days (+$175.3M).
ETF Flows (BTC/ETH)
Note: ETF data for BTC and ETH offers additional context but should not be solely relied upon for ETH trading decisions. Currently, BTC ETFs have experienced a 1-day outflow of approximately $409.8M, while ETH ETFs saw a $10.2M outflow on the same day but a significant inflow of $175.3M over the last 5 days. Longer-term flows suggest ongoing investor interest in ETH, aligning with broader risk-on sentiment, despite recent short-term outflows.
What to Watch Next
- Monitor for a decisive close above $3,366 to confirm bullish continuation towards $3,434–$3,501.
- Watch for a break below support at $3,234, which could accelerate downside toward $3,170–$3,105.
- Keep an eye on Bitcoin’s dominance and ETF flow trends as they may influence broader market sentiment.
- Assess volatility levels and RSI for signs of increased market activity or potential reversals.
Hashtags: #Ethereum #CryptoAnalysis #MarketUpdate #ETH #CryptoTrading #ETFFlows #BTC #Altcoins #TechnicalAnalysis #CryptoNews #Investing #Blockchain