Market Snapshot
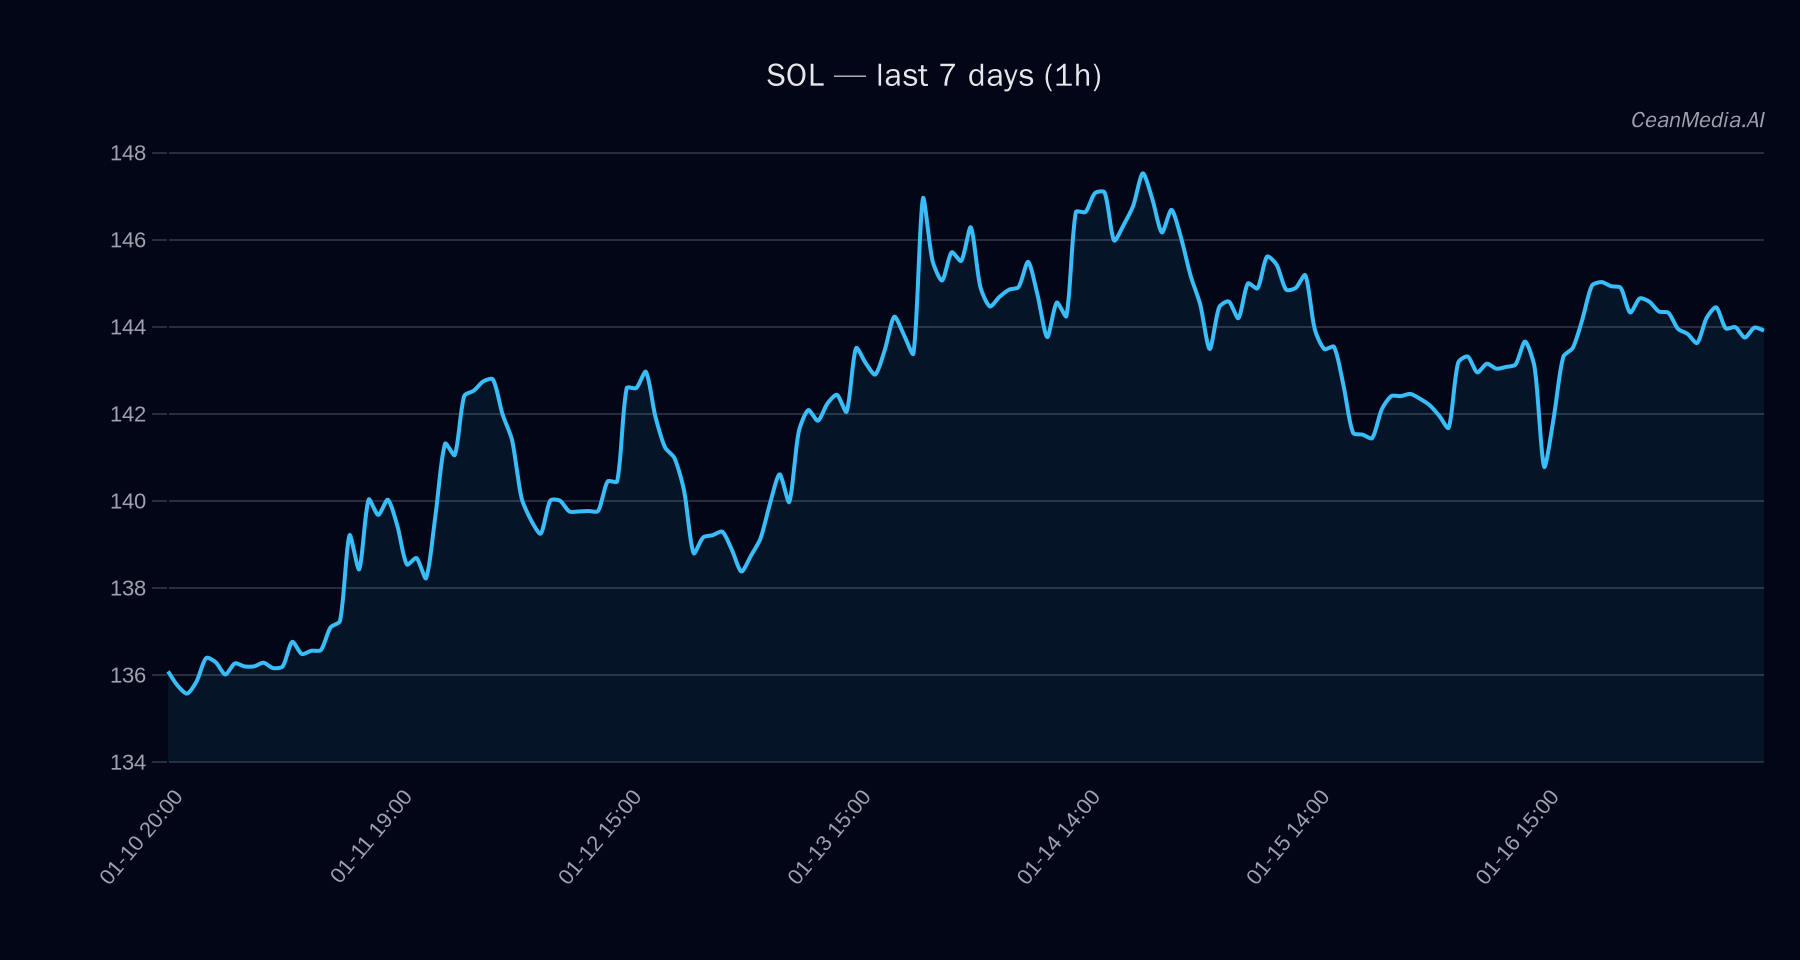
On January 17, 2026, Solana (SOL) is trading around $143.85, with a short-term bearish bias indicated by recent technical signals. Overall market sentiment remains cautious, with very low volatility and mixed momentum indicators. ETF flows into Bitcoin and Ethereum suggest a broader risk-on environment, although these are only contextual influences for SOL.
Technical Analysis: SOL
SOL is currently trading between key support at approximately $141 and resistance at around $147. A break above $147 could target levels near $150 to $152, while a decline below $141 might see the price drop to approximately $138 to $135. The technical setup shows bullish signals such as EMA12 being above EMA26, and the SMA50 above SMA200, but the RSI remains neutral at 49, indicating neither overbought nor oversold conditions. The current probability favors a downward move, with a 49% chance of decline within the next 24 hours.
Drivers
- Return 24H: Data unavailable
- EMA Slope: Slight negative at -0.0001, indicating minimal short-term bearish momentum
- Funding Z-Score: 0.53, suggesting neutral funding rates
- Basis Z-Score: -1.48, indicating a slight negative basis trend
- Order Book Imbalance (EMA5): -0.1, reflecting modest sell-side pressure
- BTC Return 24H: +0.003, showing minimal impact from Bitcoin’s recent price movements
- BTC Volatility Regime: -1, indicating very low volatility
- BTC Trend Strength: 0.28, suggesting weak upward momentum
The overall drivers point to a cautious market environment with limited short-term momentum for SOL.
ETF Flows (BTC/ETH)
Recent ETF data shows significant outflows from Bitcoin ETFs, with a 1-day decline of nearly $410 million, but inflows over the 5- and 10-day periods suggest some investor interest returning. Ethereum ETF flows are also negative on the 1-day basis but positive over longer periods. While these flows reflect a risk-on or risk-off sentiment for BTC and ETH, they do not directly dictate SOL’s short-term trajectory but provide broader market context.
What to Watch Next
- Monitor if SOL breaks above resistance at $147 for a potential move toward $150–$152
- Watch for a decline below support at $141, which could trigger further downside to $138–$135
- Keep an eye on Bitcoin and Ethereum ETF flows for signs of shifting risk appetite
- Observe changes in technical momentum indicators, especially RSI and EMA slopes, for early signals
Note: ETF flows are only for BTC and ETH and serve as contextual reference; they are not primary signals for SOL.
Hashtags: #Solana #CryptoAnalysis #MarketUpdate #Bitcoin #Ethereum #ETFFlows #TechnicalAnalysis #CryptoTrends #RiskOn #RiskOff #Altcoins #CryptoSignals