Market Snapshot
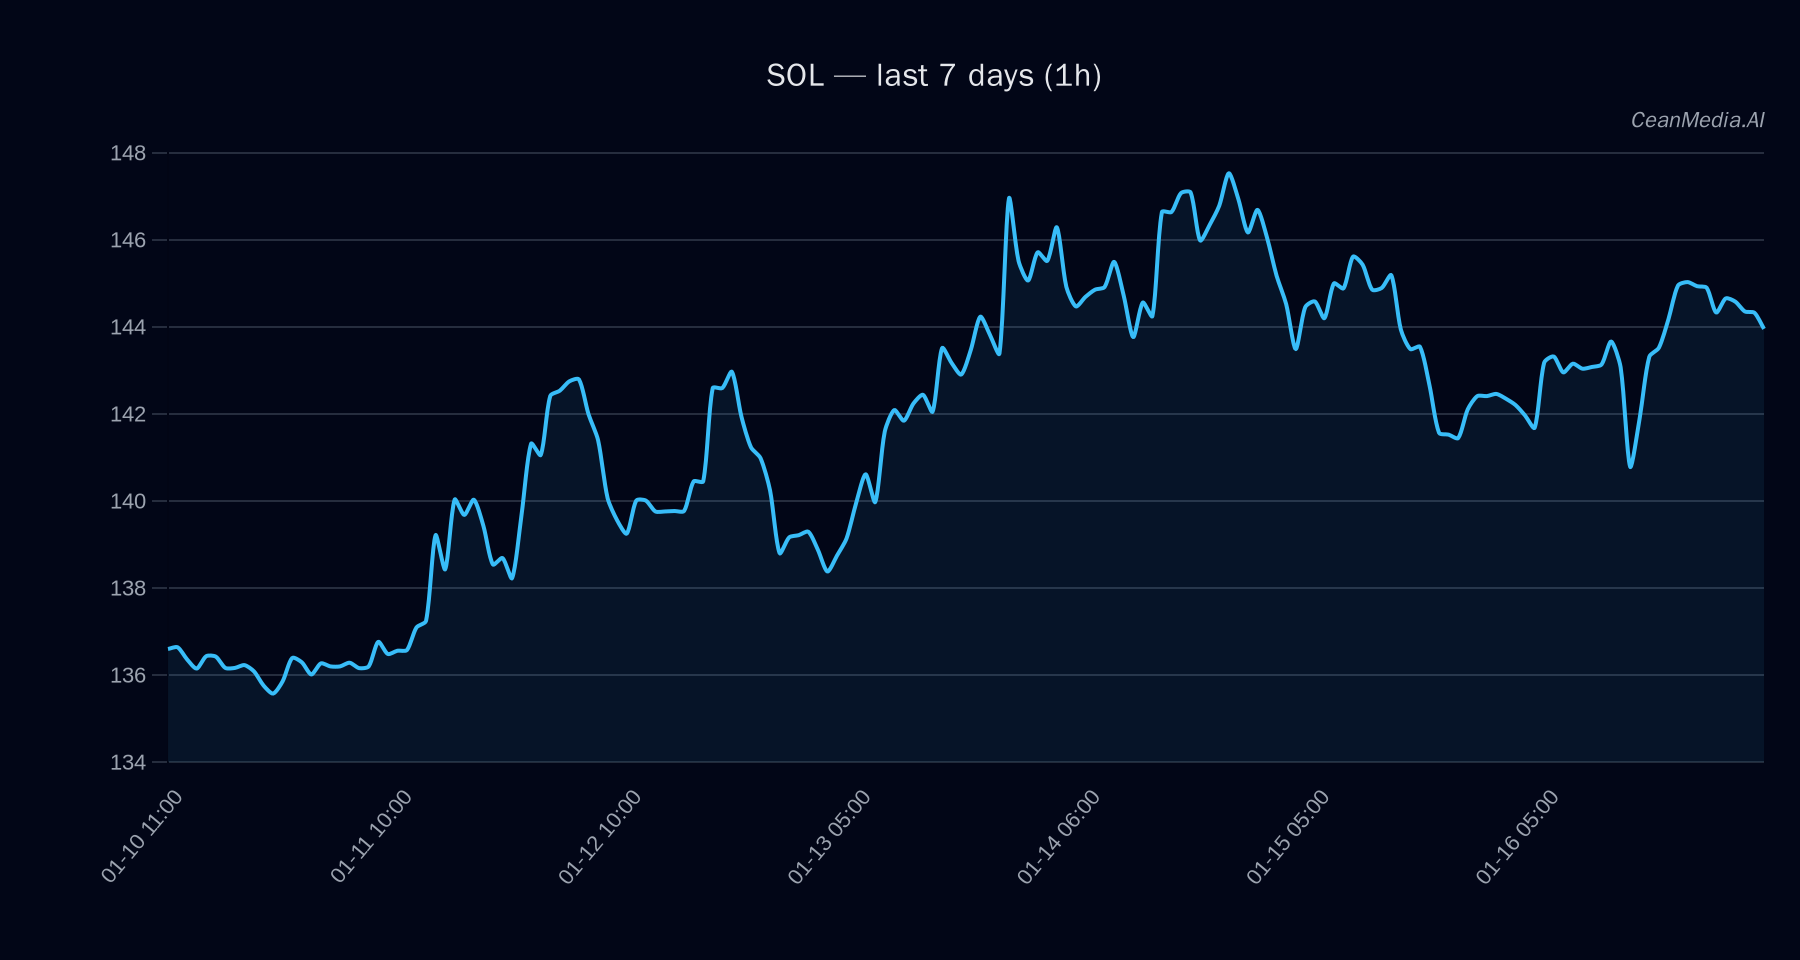
As of January 17, 2026, Solana (SOL) is trading around $143.84 with a cautious near-term outlook. The broader market shows mixed signals, with ETF flows indicating a risk-off environment for Bitcoin and Ethereum. The overall sentiment remains neutral, with low volatility and subdued momentum across major cryptocurrencies.
Technical Analysis: SOL
- Levels: Support is identified at approximately $141 (near support), with major support at $137. Resistance is near $147, with a breakout above potentially targeting $149.65–$152.59. A decline below $141 could see prices fall to $138.14–$135.32.
- Bias: The technical indicators suggest a bullish trend with EMA12 > EMA26, SMA50 > SMA200, and RSI at 50, indicating a neutral stance leaning slightly bullish. However, the forecast signals a 49% probability of downward movement.
- Triggers & Invalidation: A close above $147 would likely accelerate gains toward $152.58, while a close below $141 could invalidate bullish momentum and suggest further downside.
Drivers
- Top factors include a modest 24-hour return of 0.02%, with stable funding and basis Z-scores (~0.8 and 0.44 respectively), indicating limited short-term volatility.
- Order-book imbalance remains minimal (0.04), and Bitcoin’s 24-hour return is negligible (0.0005), with a declining BTC volatility regime, pointing to subdued overall market activity.
- Trend strength remains high (around 0.95), but breadth and correlation metrics suggest a cautious environment with no strong directional momentum.
ETF Flows (BTC/ETH)
Recent ETF data shows a significant outflow from Bitcoin ETFs, with a 1-day net loss of approximately $410 million, but a 5-day inflow of nearly $500 million, indicating some short-term risk aversion. Ethereum ETF flows are also negative for 1 day but positive over 5 and 10 days, reflecting mixed investor sentiment.
It is important to note that these flows pertain only to BTC and ETH and serve as macro risk-on/off indicators rather than direct signals for SOL. The overall risk environment appears cautious, aligning with the technical neutral-to-bullish bias for SOL.
What to Watch Next
- Monitor SOL’s price action around the key support at $141 and resistance at $147 for potential breakout or breakdown signals.
- Watch for a sustained change in ETF flows for BTC and ETH, which could influence overall risk sentiment and indirectly impact SOL.
- Keep an eye on broader market volatility and momentum indicators for signs of a shift in trend bias.
- Observe on-chain activity and funding rates for further confirmation of trend strength or potential reversals.
Hashtags: #Solana #CryptoAnalysis #MarketUpdate #Bitcoin #Ethereum #ETFFlows #TechnicalAnalysis #CryptoTrends #MarketSentiment #RiskOn #RiskOff