Market Snapshot
As of January 19, 2026, BNB is trading around $952, with a neutral short-term bias. The broader market shows subdued volatility, with ETF flows indicating mixed risk sentiment in the crypto space. Bitcoin ETFs have experienced outflows over the past day, suggesting cautiousness, while Ethereum ETFs have seen inflows, hinting at continued interest in altcoins. Overall, market breadth remains moderate with a slight upward trend in Bitcoin dominance.
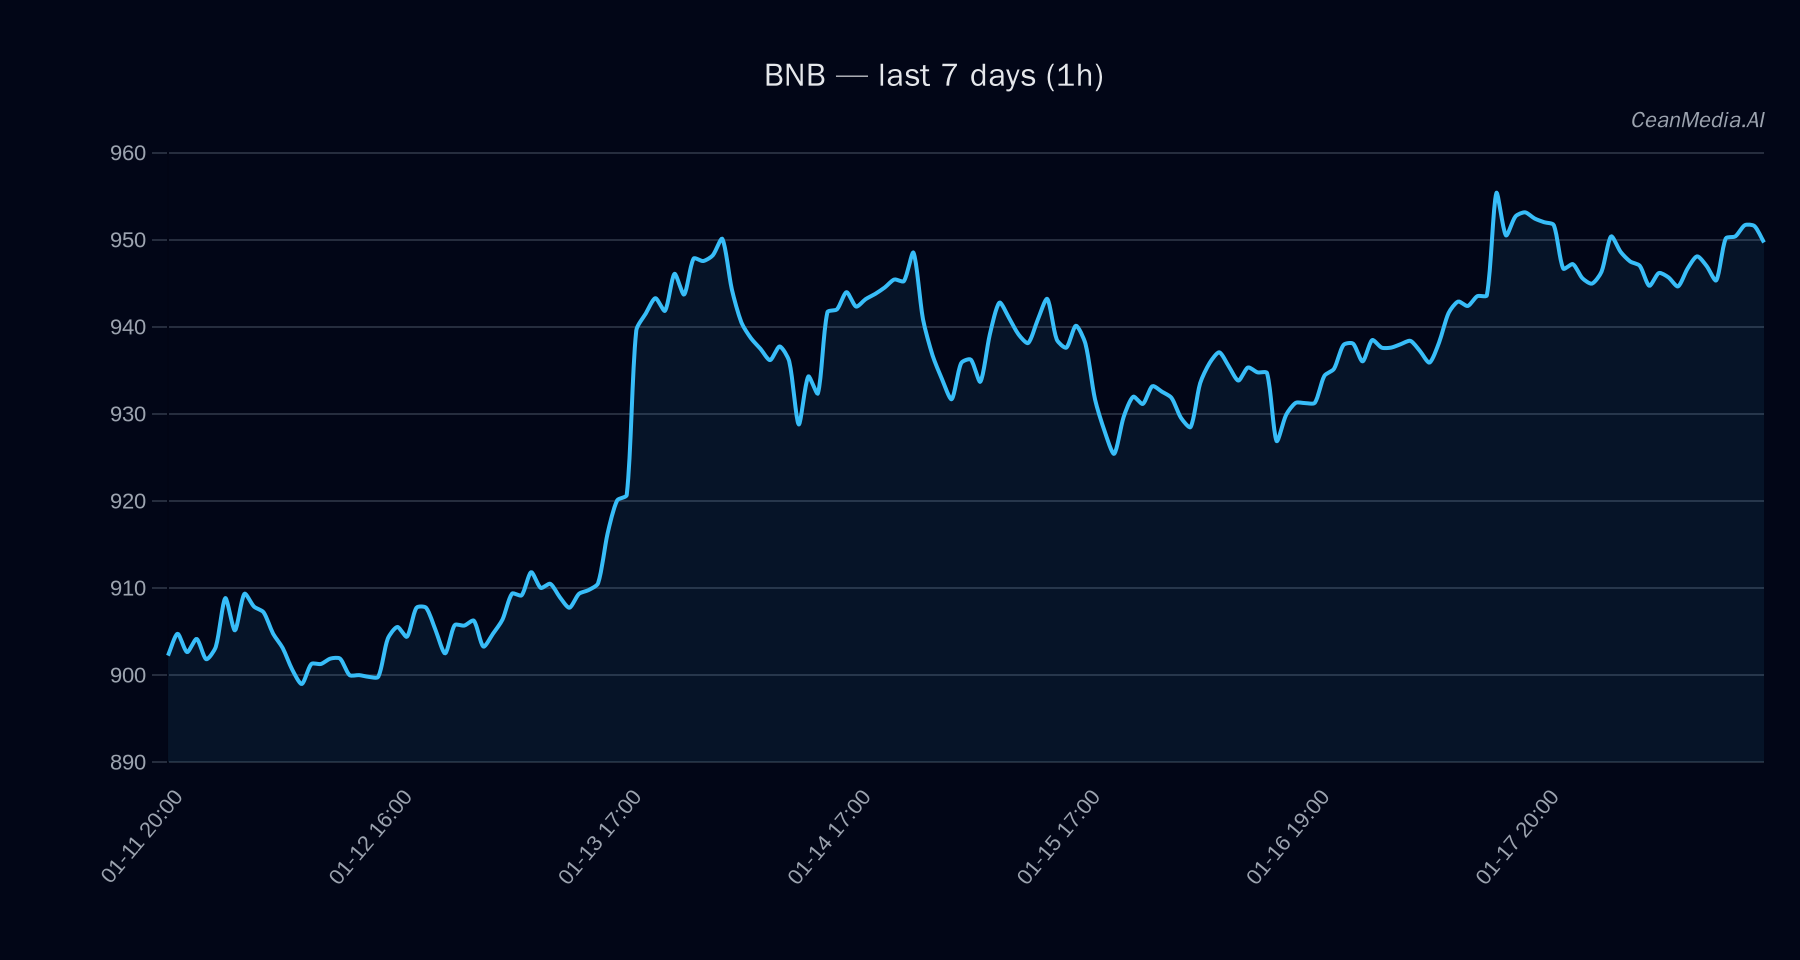
Technical Analysis: BNB
BNB currently trades between key support at approximately $933 and resistance near $971. The technical indicators point to a bullish bias, supported by the following signals:
- EMA12 is above EMA26, indicating short-term upward momentum.
- SMA50 remains above SMA200, confirming the longer-term bullish trend.
- RSI stands at 62, reflecting a neutral-to-moderate bullish momentum without overbought conditions.
- Price is close to the P50 level at around $948, with a very low volatility regime.
Break above $971 could target levels near $990–$1,010, while a break below $933 may lead towards $895–$915. The current bias is slightly tilted upward, but traders should watch for confirmation of a breakout or breakdown to validate directional moves.
Drivers
Top factors influencing BNB include:
- 24H return remains near zero at -0.29%, indicating limited immediate momentum.
- EMA slope remains positive at 0.0002, supporting ongoing upward trend.
- Funding Z-score at -0.41 suggests slight demand pressure.
- Order-book imbalance (EMA5) at 0.18 indicates modest buy-side interest.
- Bitcoin’s 24H return is minimal at 0.09%, with a declining volatility regime (-1), reflecting subdued market activity.
- Bitcoin trend strength remains modest at 0.16, aligning with overall cautious sentiment.
Market breadth exceeds 50%, and the correlation with Bitcoin over 72 hours is low at 0.06, indicating limited systemic risk. The altcoin breadth excluding mega caps is at 0%, further emphasizing a cautious environment.
ETF Flows (BTC/ETH)
Recent ETF flow data show a divergence between Bitcoin and Ethereum:
- Bitcoin ETFs experienced a significant outflow of approximately $394.7 million in one day, but have accumulated a net inflow of $515 million over the past five days, suggesting fluctuating risk appetite.
- Ethereum ETFs have seen consistent inflows, totaling around $4.7 million in one day and $190.2 million over five days, indicating sustained investor interest in ETH and potentially risk-on sentiment.
While these flows are only for BTC and ETH, they provide important context for overall market sentiment. The outflows from Bitcoin ETFs may reflect caution or profit-taking, whereas inflows into ETH suggest continued confidence in altcoins.
What to Watch Next
- Monitor if BNB breaks above resistance at $971 for potential upside targets near $1,010.
- Observe if price sustains below $933, which could lead to a test of lower support levels around $895.
- Keep an eye on broader ETF flows, especially if Bitcoin outflows persist, which could impact overall risk sentiment.
- Watch for any significant changes in volatility or momentum indicators that could signal a shift in trend direction.
Hashtags: #Crypto #BNB #MarketAnalysis #TechnicalAnalysis #ETFFlows #Bitcoin #Ethereum #Altcoins #MarketSentiment #CryptoTrends #TradingInsights #DigitalAssets