Market Snapshot
As of January 20, 2026, LINK is trading around $12.41, with a short-term bearish bias indicated by technical signals and low volatility conditions. The broader market sentiment shows mixed flows, notably with a decline in Bitcoin ETF holdings and positive flows in Ethereum ETFs, reflecting a cautious risk environment.
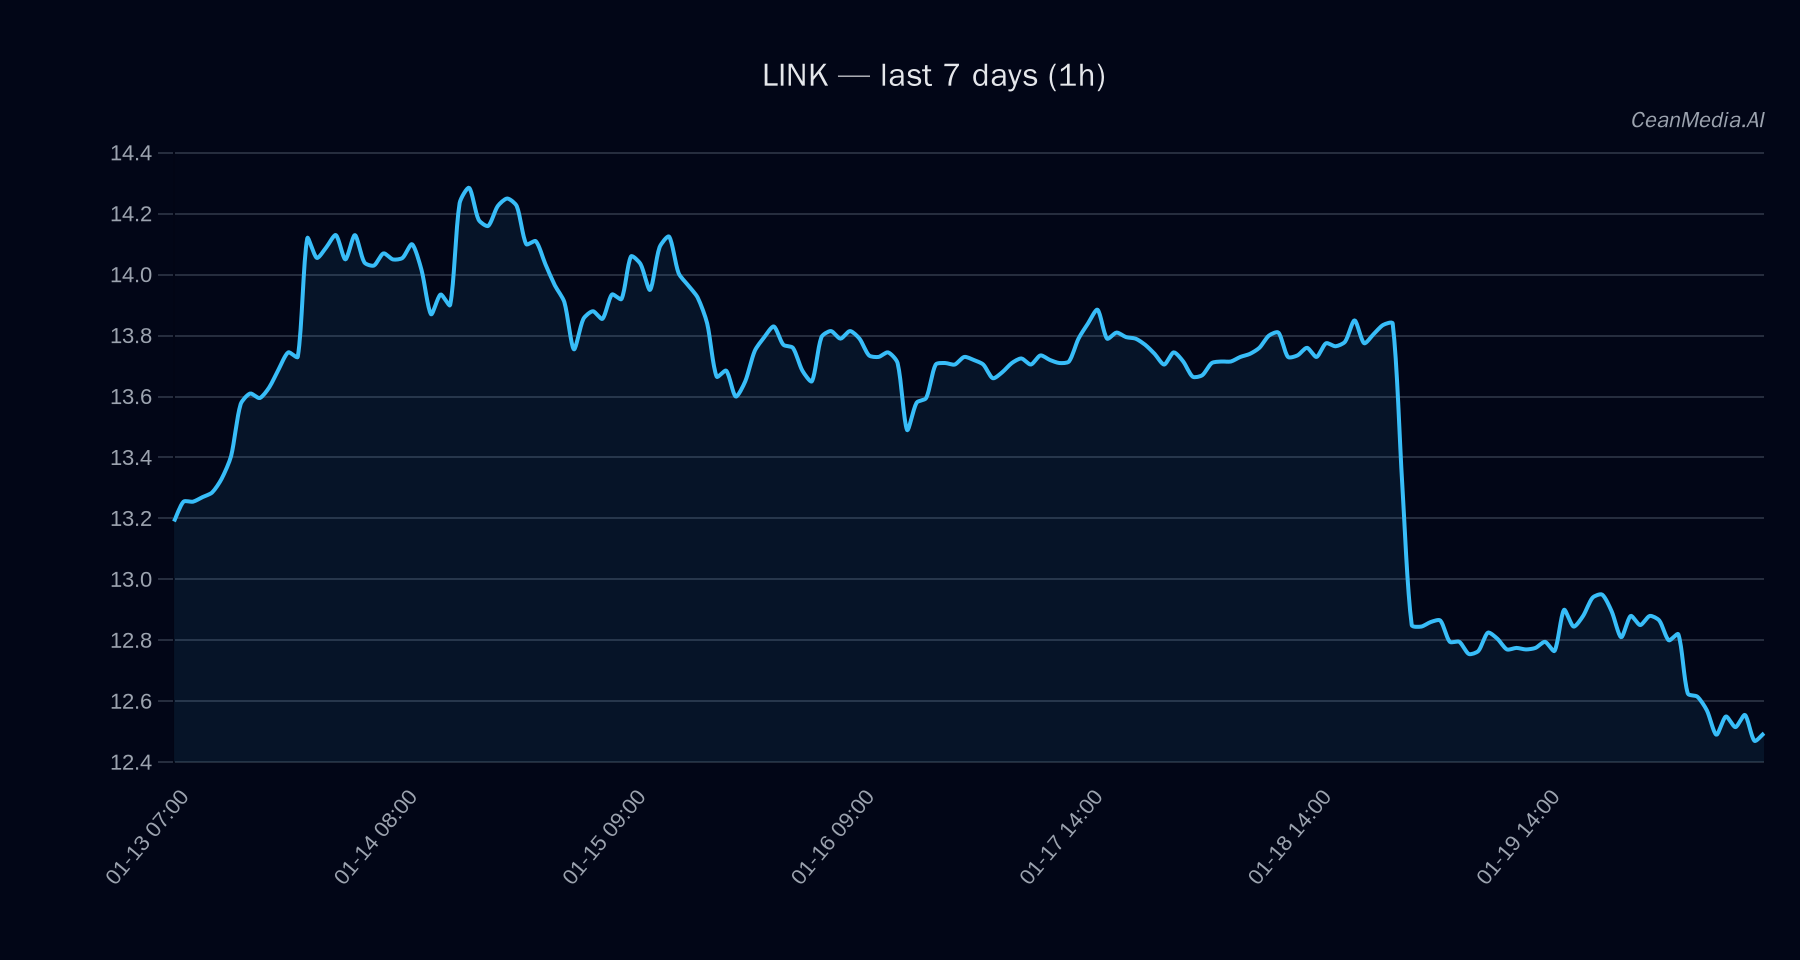
Technical Analysis: LINK
LINK currently sits between key support at approximately $12.2 and resistance at about $12.7. The technical indicators suggest a bearish trend:
- EMA12 is below EMA26, indicating short-term downward momentum.
- SMA50 remains below SMA200, supporting a longer-term bearish outlook.
- RSI is at 27, indicating an oversold condition, which could precede a short-term rebound.
- The current price is closer to support levels, with a break below $12.2 potentially targeting $11.68–$11.92.
- Conversely, a close above $12.7 could trigger a move toward $12.91–$13.16.
The overall bias remains bearish with a 51% probability of downside in the next 24 hours. Invalidations for bullish moves would be a close above $12.7, while a breakdown below $12.2 would confirm further downside risk.
Drivers
The primary factors influencing LINK include:
- 24H return at -0.02%, indicating minimal recent price movement.
- EMA slope at -0.0015, reflecting ongoing short-term downward momentum.
- Funding Z-score at 0.68 and Basis Z-score at 0.52, suggesting neutral to slightly negative funding conditions.
- Order-book imbalance (EMA5) at +0.06, indicating slight buying interest but not enough to reverse the trend.
- Bitcoin’s 24H return at -0.02% and flat volatility regime suggest subdued market activity, which correlates with LINK’s low volatility environment.
- Market sentiment remains cautious, with Fear & Greed Index at 32, indicating a fear-driven market.
Market momentum appears fragile, with low volatility and oversold RSI hinting at potential short-term rebound, but overall trend remains bearish.
ETF Flows (BTC/ETH)
Recent ETF flow data shows a divergence between Bitcoin and Ethereum:
- Bitcoin ETFs have experienced a net outflow of approximately $394.7 million over the past day, with a 5-day inflow totaling +$515 million, indicating short-term risk-off sentiment for Bitcoin.
- Ethereum ETFs, on the other hand, have seen a small daily inflow of +$4.7 million, with sustained positive flows over 5 and 10 days (+$190.2M and +$120M respectively), suggesting a shift towards risk-on sentiment in ETH.
While these flows are only for BTC and ETH, they provide context for overall market sentiment, with ETH showing resilience and Bitcoin exhibiting caution. These trends may influence altcoins like LINK indirectly, particularly if risk appetite shifts.
What to Watch Next
- Monitor if LINK breaks below the support at $12.2, which could accelerate downside movement towards $11.68–$11.92.
- Watch for a close above $12.7 to confirm potential short-term recovery towards $12.91–$13.16.
- Observe broader market risk sentiment, especially ETH ETF inflows, as an indicator of risk appetite.
- Keep an eye on Bitcoin ETF outflows, which may reinforce cautious or bearish market conditions.
Note: ETF flow data is only available for BTC and ETH and serves as market context rather than a direct signal for LINK.
Hashtags: #Crypto #LINK #Bitcoin #Ethereum #MarketAnalysis #TechnicalAnalysis #Altcoins #ETFFlows #CryptoTrends #RiskOn #RiskOff #MarketSentiment