Market Snapshot
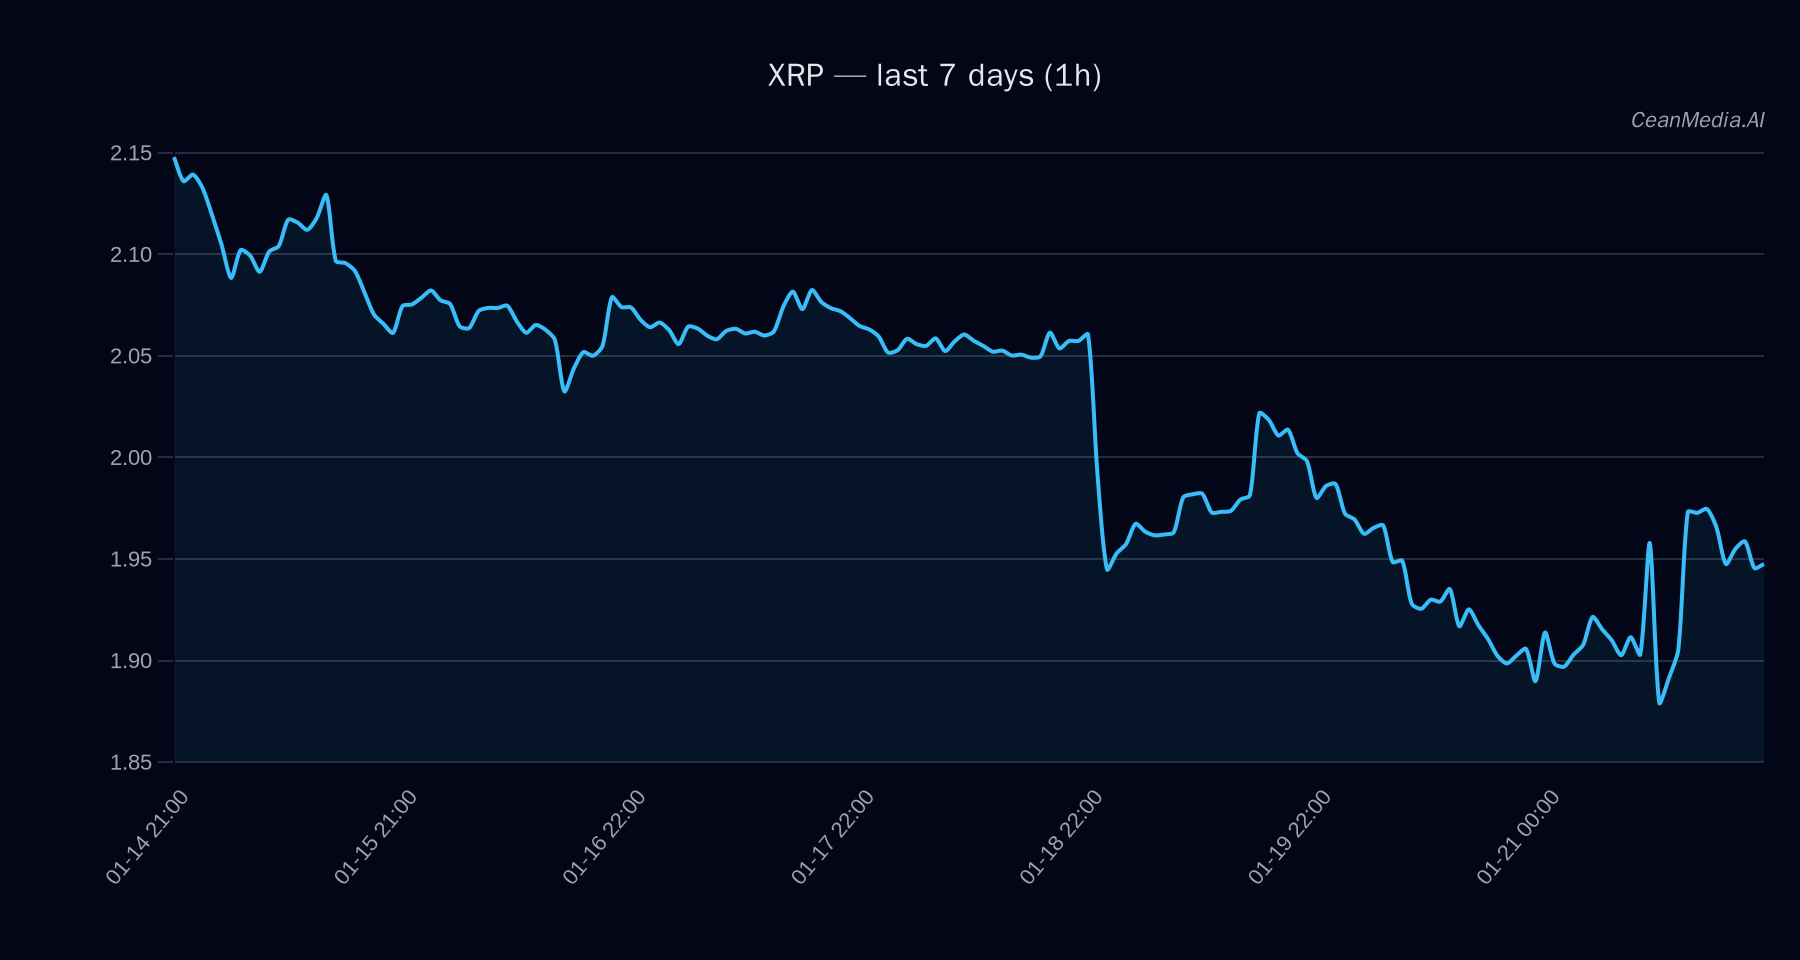
On January 22, 2026, XRP is trading near key support and resistance levels, with a current price of approximately $1.95. Broad market sentiment shows a risk-off environment, evidenced by declining ETF flows in both Bitcoin and Ethereum over the past week. The overall market breadth remains moderate, with a 50% breadth indicator and high correlation with Bitcoin, suggesting a cautious stance among investors.
Technical Analysis: XRP
XRP’s technical landscape indicates sideways movement with a slight bearish bias. The current price is between the major support at $1.92 and resistance at $2.00. A break above $2.00 could lead to a move towards $2.03–$2.07, while a decline below $1.92 may see the price testing the lower support zone of approximately $1.84–$1.88. Key technical indicators include:
- EMA12 above EMA26, signaling short-term momentum
- SMA50 below SMA200, indicating a longer-term bearish trend
- RSI at 54, reflecting neutral momentum
- Low volatility regime, with a 24-hour sigma of 1.34%
The forecast assigns a 49% probability to a downward move, with the primary invalidation point being a close above $2.00.
Drivers
- 24H Return: +0.03%
- EMA Slope: minimal upward slope (0.0001)
- Funding Z-Score: 0.68, indicating balanced funding rates
- Basis Z-Score: -1.06, signaling slight negative basis pressure
- Order-Book Imbalance (EMA5): 0.11, showing mild buying interest
- Bitcoin 24H Return: +0.01%, correlating closely with XRP’s movement
- Bitcoin Volatility Regime: low (1)
- Bitcoin Trend Strength: 0.23, indicating weak trend momentum
Market breadth remains above 50%, and the 7-day return volatility (RV) is around 3.3%, suggesting subdued short-term market activity. Overall, momentum is neutral, with no strong directional signals currently prevailing.
ETF Flows (BTC/ETH)
Recent ETF data reveals significant outflows, with Bitcoin ETFs declining by approximately $352 million in one day and over $1.06 billion over five days. Ethereum ETFs have experienced smaller but consistent outflows. This risk-off behavior in major cryptocurrencies underscores a cautious investor sentiment, which may influence altcoins like XRP indirectly. It is important to note that these ETF flows are only for BTC and ETH and serve as contextual indicators rather than direct signals for XRP.
What to Watch Next
- Monitor if XRP breaks above $2.00 for potential bullish confirmation
- Watch for a decline below $1.92 to confirm downside momentum
- Keep an eye on Bitcoin and Ethereum ETF flows as broader risk sentiment indicators
- Observe changes in market breadth and volatility for signs of trend shifts
Hashtags: #XRP #CryptoAnalysis #MarketUpdate #TechnicalAnalysis #ETFFlows #Bitcoin #Ethereum #Altcoins #CryptoTrends #RiskOff #MarketSentiment