Market Snapshot
Cardano (ADA) trades around the 0.248–0.255 region with a near-term setup characterized by a tight price range between major support at 0.24 and resistance at 0.26. The latest internal model signals place the asset in a cautious stance with a backdrop of very low volatility.
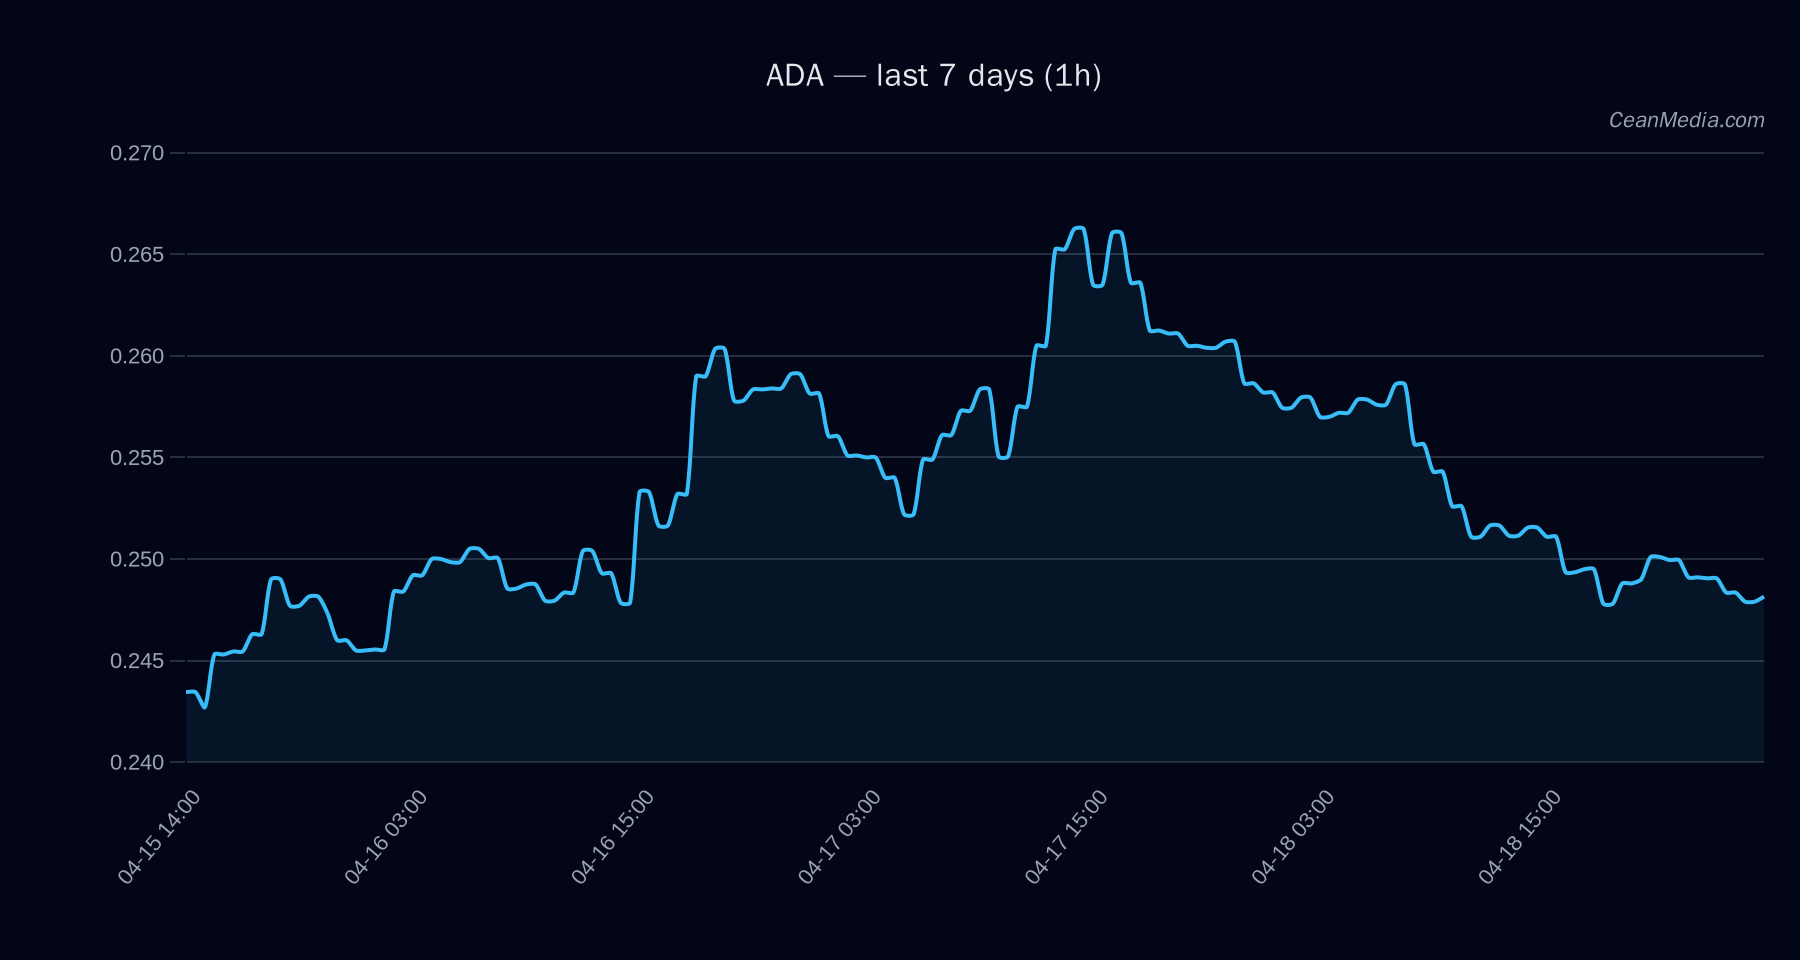
Technical Analysis: ADA
- Current price: 0.2487
- Short-Term Forecast: Up (49% probability). Range-bound with upside triggers above 0.255 potentially targeting 0.2587–0.2638; downside protection below 0.245 opens a path toward 0.2389–0.234.
- Key levels: Support major at 0.24; Support near 0.245; Resistance major at 0.26; Resistance near 0.255.
- Bias and indicators: TA notes sideways dynamics with EMA12
- Band and targets: Price band (P20–P80) sits at 0.2475–0.2727. Upside if 1h close > 0.255: guidance toward 0.2587–0.2638. Downside if 1h close < 0.245: potential move to 0.2389–0.234.
- Invalidation: A break above 0.26 or below 0.24 would constitute a shift in immediate trajectory, with respective targets adjusting to the next resistance/support pockets.
Drivers
- Top model drivers include SPREAD BP (positive contribution) and LIQ IMB Z-SCORE (negative signal), with combined effects shaping short-term momentum.
- Liquidity dynamics (LIQ IMB EMA12, OI-related measures) and trend indicators (RV 7D, BTC trend strength) contribute to the current neutral-to-mixed momentum picture.
- BTC-related factors (BTC return and BTC vol regime) are playing a contextual role, given the crypto market’s connectedness, while ADA-specific signals point toward a cautious stance given the low volatility regime.
ETF Flows (BTC/ETH)
ETF flow data provided focuses on BTC and ETH, reflecting overall risk-on/risk-off sentiment in the broader market context. BTC ETFs show positive daily, 5-day, and 10-day inflows, suggesting a supportive environment for risk assets in the narrow term. ETH ETF inflows are also positive over the 1D/5D/10D horizons. It is important to note that ETF data is contextual and not a primary signal for ADA; ADA-specific moves can diverge from BTC/ETH flow patterns.
What to Watch Next
- Monitor a daily close above 0.255 for potential acceleration toward 0.2587–0.2638.
- Watch for a break below 0.245, which could lead toward 0.2389–0.234 in the short term.
- Track BTC ETF inflows/volatility as a broad market backdrop, but rely on ADA-specific levels for tactical decisions.
- Observe changes in RSI and volatility regime, as a shift from very low to higher volatility could precede a structural repositioning.
Hashtags: #ADA #CryptoAnalysis #MarketSnapshot #TechnicalAnalysis #ETFFlows #BTC #ETH #Altcoin #Liquidity #Momentum #TradingStrategy #PriceAction