Market Snapshot
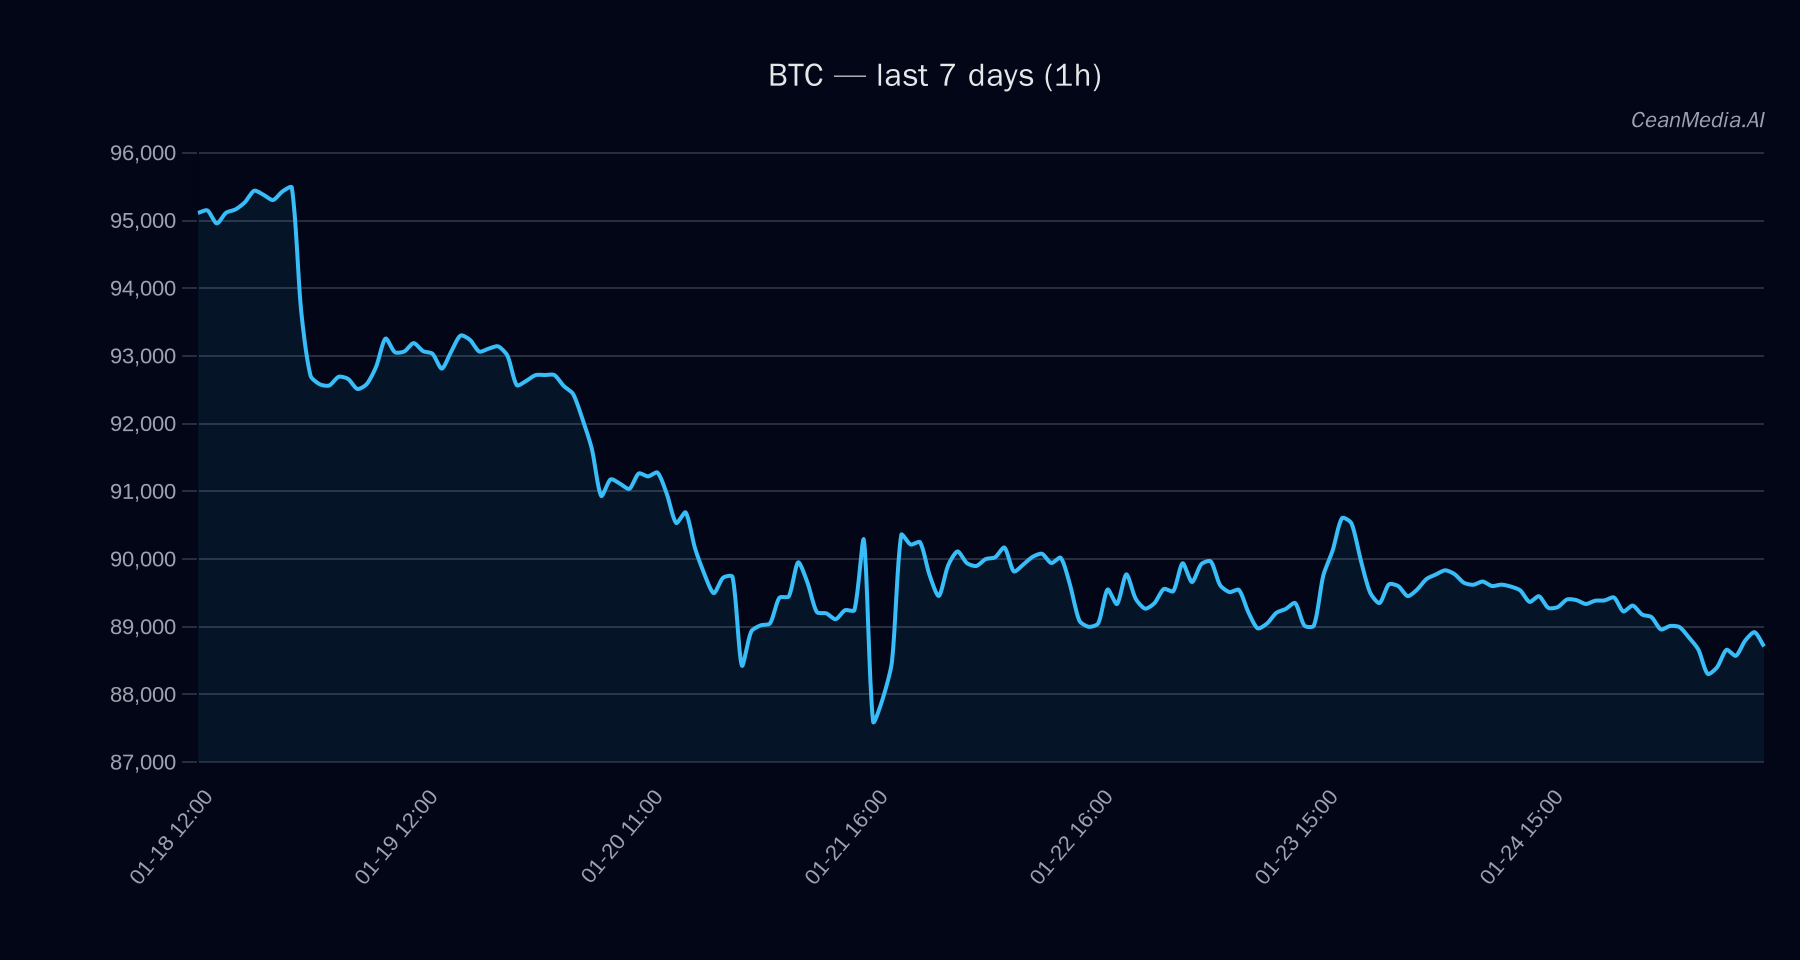
As of January 25, 2026, Bitcoin (BTC) is trading around $88,730.51 amid a very low volatility regime. The market sentiment remains cautious, with recent 24-hour returns near zero, reflecting a period of consolidation. Broader ETF flows indicate significant outflows from BTC and ETH ETFs over the past week, suggesting risk-off sentiment among institutional investors. The overall market breadth remains subdued, with no significant directional bias apparent from recent breadth and correlation data.
Technical Analysis: BTC
Bitcoin is currently trading between key support at approximately $86,950 and resistance at $90,500. The technical indicators show a bearish bias: the EMA12 is below the EMA26, and the SMA50 remains below the SMA200, with the RSI at 42, indicating neutral momentum. The market’s short-term forecast suggests a slight upward bias with a 48% probability that the price will move higher within the next 24 hours. Breakouts above $90,500 could target levels around $92,315 to $94,125, while a decline below $86,950 may see prices tested down to approximately $83,478. Invalidation of the bullish scenario would occur if the price closes below the support zone, confirming further downside risk.
Drivers
- Return 24H: -0.005
- EMA Slope: 0.0002
- Funding Z-Score: 1.19
- Basis Z-Score: -0.61
- Order-Book Imbalance (EMA5): -0.13
- BTC Return 24H: -0.005
- Vol Regime: Very low (-1)
- Trend Strength: 0.62
The combination of these factors indicates a market that is technically bearish in the short term but with some underlying strength. The low volatility and neutral RSI suggest limited immediate momentum, while the funding and order book data point to cautious trading activity.
ETF Flows (BTC/ETH)
Recent ETF data shows substantial outflows: BTC ETFs have experienced a total outflow of approximately $1.34 billion over the past five days, with a daily outflow of $103.5 million. ETH ETFs have also seen notable outflows, totaling around $301.3 million over five days. These flows reflect a broader risk-off environment, with investors reducing exposure to crypto assets. It is important to note that this ETF data pertains only to BTC and ETH and serves as contextual information rather than a primary trading signal for BTC.
What to Watch Next
- Monitor if BTC breaks above resistance at $90,500 for a potential move towards $92,300–$94,125.
- Watch for a decline below support at $86,950, which could lead to further downside testing around $83,500.
- Keep an eye on ETF flows and broader macroeconomic indicators, as they may influence risk appetite.
- Observe upcoming technical signals or volume spikes that could confirm a trend reversal or continuation.
Hashtags: #Bitcoin #CryptoAnalysis #MarketUpdate #ETFFlows #TechnicalAnalysis #CryptoTrends #FinancialMarkets #BTC #ETH #RiskOff #TradingSignals #CryptoNews