Market Snapshot
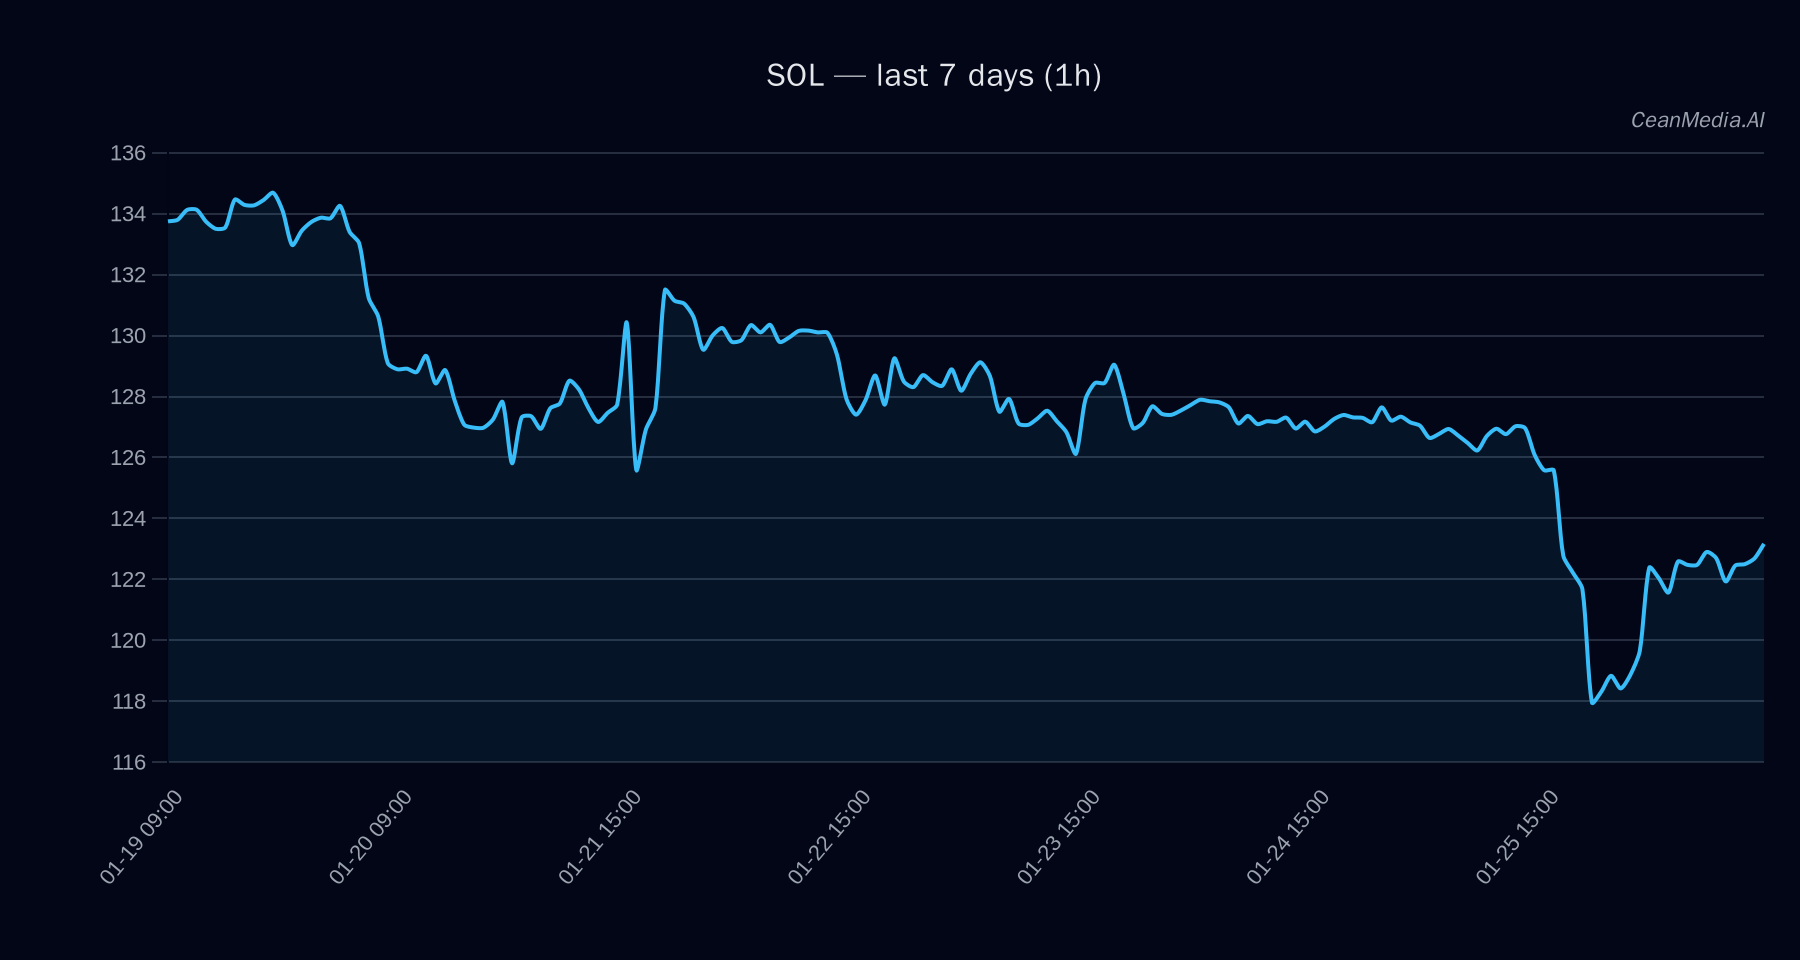
On January 26, 2026, Solana (SOL) is trading around $123.50 with a short-term bias leaning upward, supported by a neutral RSI of 54. The market exhibits very low volatility, with a breadth above 50% and a slight negative return over the past 24 hours (-0.03%). The broader crypto environment shows signs of extreme fear, with Bitcoin dominance at 57.4%, down slightly over the week.
Technical Analysis: SOL
Current price sits between key support at approximately $121 and resistance at $126. A breakout above $126 could target levels around $128.49 to $131.01. Conversely, a decline below $121 could see SOL testing lower support levels near $118.61 to $116.19.
Technical indicators suggest a bearish setup: the EMA12 is below EMA26, and the SMA50 remains below SMA200, indicating a longer-term downtrend. RSI at 54 remains neutral, supporting a cautious outlook. The probability of a short-term upward move is approximately 54%, but the prevailing trend remains bearish unless key resistance levels are broken convincingly.
Drivers
- Return 24H: Slight negative at -0.03%
- EMA Slope: Marginal positive at 0.0011, indicating minimal upward momentum
- Funding Z-Score: Neutral at 0.0099
- Basis Z-Score: Slightly positive at 0.09
- Order Book Imbalance (EMA5): Near neutrality at 0.09
- BTC Return 24H: Slightly negative at -0.01%
- Market Volatility Regime: Very low, indicating subdued market activity
- Trend Strength: Moderate at approximately 0.55
Overall, the technical landscape indicates a cautious environment with potential for short-term upward movement if resistance levels hold and are broken.
ETF Flows (BTC/ETH)
Recent ETF data shows significant outflows from both Bitcoin and Ethereum ETFs, with BTC ETFs experiencing daily outflows of approximately $103.5 million and cumulative 5-day outflows exceeding $1.34 billion. ETH ETFs have similarly seen daily outflows of around $41.7 million over the past day. These flows suggest a risk-off sentiment prevailing in broader markets, which could indirectly influence altcoin performance, including SOL, though ETF data is only available for BTC and ETH and should be viewed as contextual rather than primary signals.
What to Watch Next
- Monitor whether SOL can break above the key resistance at $126 to confirm bullish momentum.
- Watch for sustained ETF outflows in Bitcoin and Ethereum, indicating broader risk aversion.
- Observe changes in volatility and breadth indicators for signs of market stabilization or further decline.
- Keep an eye on Bitcoin’s trend strength and market dominance, as they can influence altcoin movements.
Hashtags: #Solana #CryptoAnalysis #BTC #ETH #MarketUpdate #TechnicalAnalysis #ETFFlows #Altcoin #CryptoTrends #RiskOff #MarketSentiment #CryptoForecast