Market Snapshot
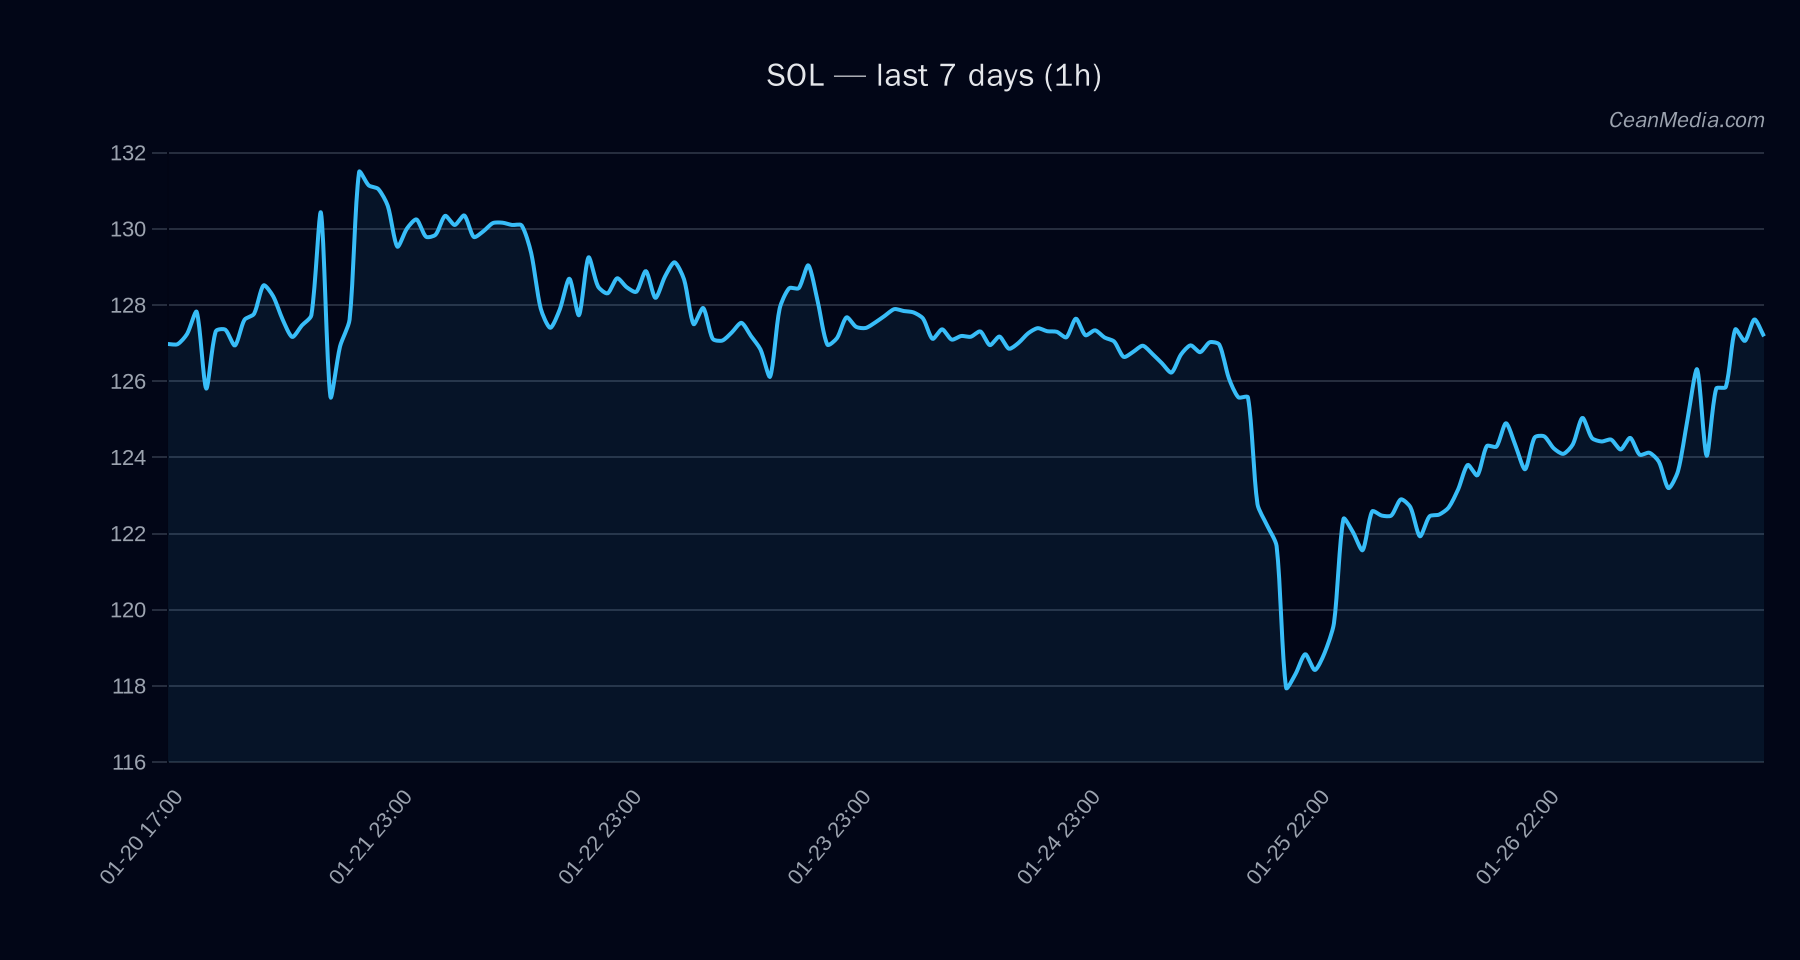
As of January 28, 2026, Solana (SOL) is trading around $127.19 with a neutral short-term bias. Market breadth remains strong, with a 100% bullish tilt over the past 50 hours. Bitcoin and Ethereum ETF flows indicate mixed investor sentiment across traditional crypto assets, with BTC ETFs experiencing a recent inflow and ETH ETFs showing a smaller but positive trend. These ETF movements provide context but are not primary drivers for SOL.
Technical Analysis: SOL
- Levels: Support is identified at approximately $125, with major resistance at around $130. A break above $130 targets a range of $132.33 to $134.92, while a decline below $125 risks a move toward $119.66 to $122.15.
- Bias: The current technical setup suggests sideways movement, with EMA12 above EMA26, SMA50 below SMA200, and RSI at 62, indicating a neutral momentum.
- Triggers: A close >$130 on a 1-hour timeframe signals a potential move towards $132.33–$134.92. Conversely, a close below $125 suggests downside risk toward $119.66–$122.15.
- Invalidation: A sustained move below $125 or above $130 would invalidate the current sideways outlook and suggest a directional trend.
Drivers
- Top Factors: The 24-hour return remains modest at 0.02%, with EMA slope indicating slight upward momentum. Funding Z-score at 1.08 reflects moderate bullish funding activity, while order book imbalance is neutral (-0.08).
- Momentum & Volatility: The trend strength is moderate at approximately 0.70, and volatility measures are very low, indicating subdued market activity. Bitcoin’s 24-hour return is minimal at 0.01%, supporting a cautious outlook.
ETF Flows (BTC/ETH)
Recent ETF data shows a positive inflow for Bitcoin ETFs (+$6.8M over 1 day), suggesting a risk-on environment for BTC. ETH ETFs also experienced a notable inflow (+$119.5M), indicating renewed investor interest in Ethereum. However, over longer periods, ETF flows have been predominantly negative for both assets, reflecting some risk-off sentiment. These flows serve as context for overall market sentiment but are not primary signals for SOL.
What to Watch Next
- Monitor if SOL breaks above $130 for a potential rally towards $132.33–$134.92.
- Watch for a sustained move below $125, which could trigger a decline towards $119.66–$122.15.
- Keep an eye on Bitcoin and Ethereum ETF flows for broader risk sentiment shifts.
- Observe upcoming macroeconomic developments that could influence liquidity and investor risk appetite.
Hashtags: #Solana #CryptoAnalysis #MarketUpdate #ETFFlows #BTC #ETH #CryptoTrading #TechnicalAnalysis #CryptoNews #Investing #Blockchain #DigitalAssets