Market Snapshot
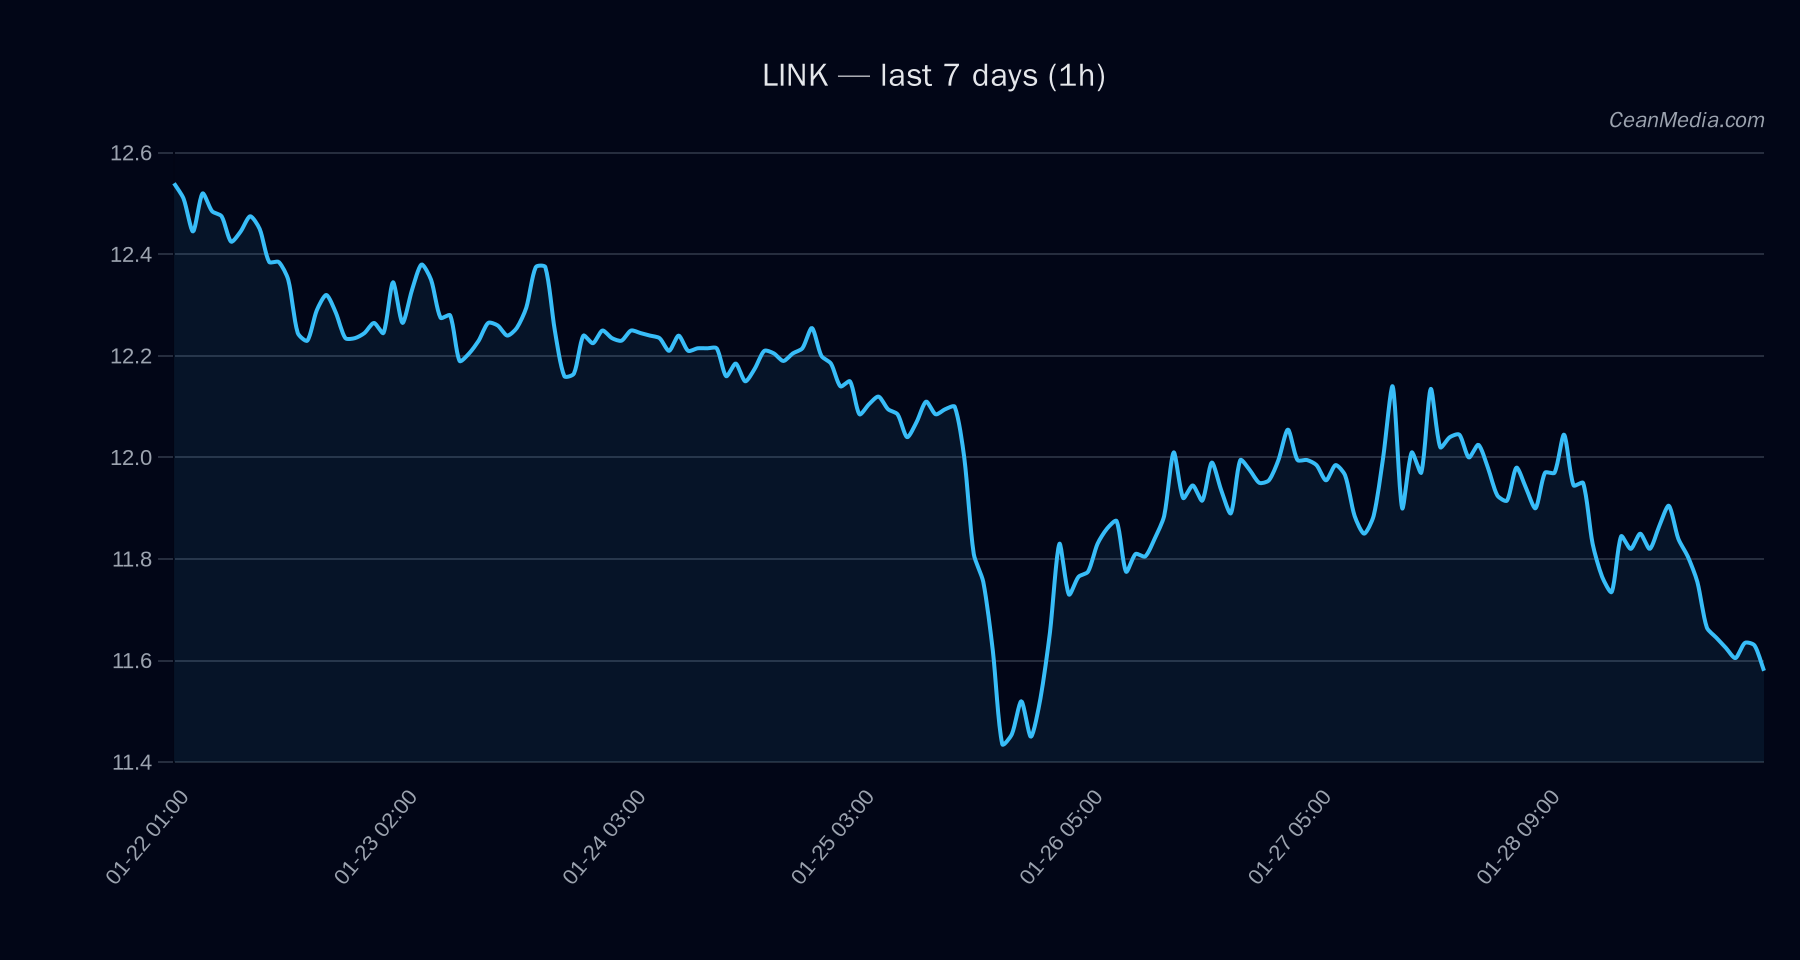
On January 29, 2026, LINK is trading at approximately $11.59 with a short-term bias leaning towards downside. The current technical environment exhibits bearish signals with an EMA12 below EMA26, and the RSI at 33 indicating oversold conditions. Market volatility remains very low, and the overall breadth signals a cautious stance among traders.
Technical Analysis: LINK
- Levels: Support at approximately $11.4; resistance near $11.8. Break above $11.8 targets $12.06–$12.29, while a break below $11.4 could lead to declines towards $10.90–$11.13.
- Bias: Bearish, with a 47% probability of downside movement based on current indicators.
- Triggers: A daily close above $11.8 would suggest potential upward momentum, whereas a close below $11.4 signals further downside.
- Invalidation: Break below $11.4 invalidates short-term support, increasing risk of further decline.
Drivers
- Top factors include a slight negative return in the past 24 hours (-0.03%) and a declining EMA slope (-0.0017), indicating weakening momentum.
- The funding Z-score at -2.17 suggests bearish funding sentiment, while the basis Z-score at 0.85 indicates neutral to slightly bullish basis conditions.
- Order-book imbalance remains negative, and Bitcoin’s 24-hour return is nearly flat (-0.0098%), with low volatility and trend strength signals reflecting subdued market activity.
ETF Flows (BTC/ETH)
Recent ETF data shows significant outflows from Bitcoin ETFs, with a 1-day decline of $5.4M and a 10-day outflow of approximately $1.22B. Conversely, Ethereum ETFs have experienced inflows, totaling +$2.7M in the past day and +$80.2M over five days, though they saw a slight decline over ten days (-$73.1M). These flows indicate a potential risk-on sentiment for ETH, while BTC remains under pressure. It is important to note that ETF flows for BTC and ETH are only a contextual factor and do not directly influence LINK’s technical outlook.
What to Watch Next
- Monitor LINK’s price action around the $11.8 resistance and $11.4 support levels for potential breakout or breakdown signals.
- Watch for a daily close above or below key levels to determine short-term directional bias.
- Keep an eye on broader market sentiment, especially Bitcoin and Ethereum ETF flows, for risk appetite cues.
- Observe changes in RSI and volatility regimes for early signs of trend reversal or acceleration.
Hashtags: #Crypto #LINK #MarketAnalysis #TechnicalAnalysis #ETFFlows #Bitcoin #Ethereum #Altcoins #CryptoTrading #MarketSentiment #CryptoNews