Market Snapshot
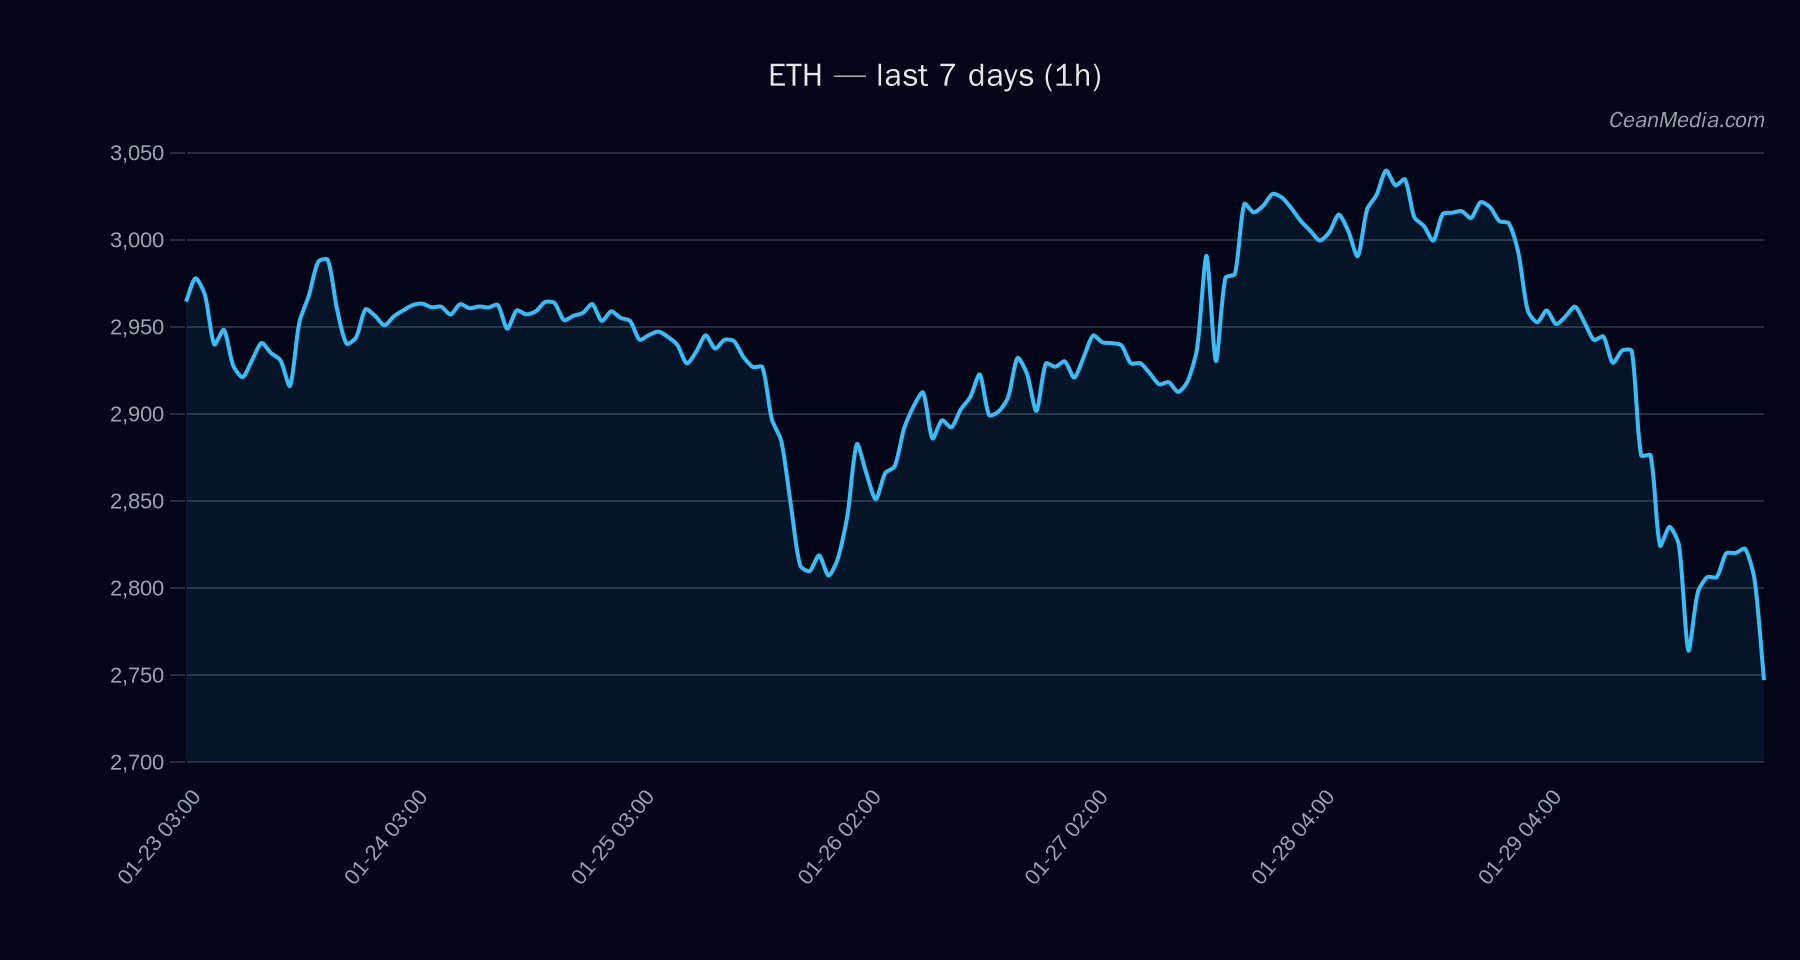
As of January 30, 2026, Ethereum (ETH) is trading around $2,736.44, with technical indicators suggesting a sideways to bearish bias in the near term. The broader market remains cautious, with ETF flows showing mixed signals between Bitcoin and Ethereum assets. Key support levels are identified at approximately $2,682, and resistance at $2,792, with a potential move higher if resistance is breached.
Technical Analysis: ETH
- Levels: Support at 2,682; resistance at 2,792; breakout targets above resistance at 2,846–2,902; breakdown targets below support at 2,628–2,574.
- Bias: Short-term forecast indicates a sideways movement with a slight downward tilt, with a 47% probability of decline based on current technical signals.
- Triggers: A close above 2,792 could accelerate upward momentum towards 2,846–2,902. Conversely, a close below 2,682 may lead to further declines towards 2,574–2,628.
- Invalidation: The bullish scenario would be invalidated if ETH closes below 2,682, confirming continued downside risk.
Technical indicators such as EMA12
Drivers
- Top Factors: The 24-hour return remains slightly negative at -0.07%, with EMA slope indicating a mild downward trend (-0.002). Funding Z-score and Basis Z-score are notably negative at -1.54 and -3.27 respectively, reflecting bearish funding conditions.
- Momentum & Volatility: BTC’s 24-hour return is also negative at -0.06%, with a trend strength of approximately 1.68, and a volatility regime at level 1, indicating low volatility in the market environment.
- Market Sentiment: Extreme Fear is prevalent with a Fear & Greed index of 16, suggesting cautious or risk-averse sentiment among traders.
ETF Flows (BTC/ETH)
Recent ETF flow data shows a divergence between Bitcoin and Ethereum. Bitcoin ETFs have experienced significant outflows over the past 10 days, totaling approximately -$1.22 billion, indicating risk-off sentiment in BTC. Conversely, ETH ETFs have seen inflows of +$80.2 million over the same period, suggesting a relative risk-on appetite for ETH. It is important to note that ETF flows are only a partial context and should not be solely relied upon for trading decisions on ETH itself.
What to Watch Next
- Monitor ETH’s close above 2,792 for potential bullish breakout towards 2,846–2,902.
- Watch for a close below 2,682 to confirm continuation of downside trend.
- Keep an eye on overall market sentiment, especially the Bitcoin ETF outflows and inflows, as a risk-on/off indicator.
- Observe changes in RSI and volatility levels for early signals of trend reversals or acceleration.
Hashtags: #Ethereum #CryptoAnalysis #MarketUpdate #ETH #Bitcoin #ETFFlows #TechnicalAnalysis #CryptoTrends #Investing #Blockchain #CryptoMarket #PriceForecast