Market Snapshot
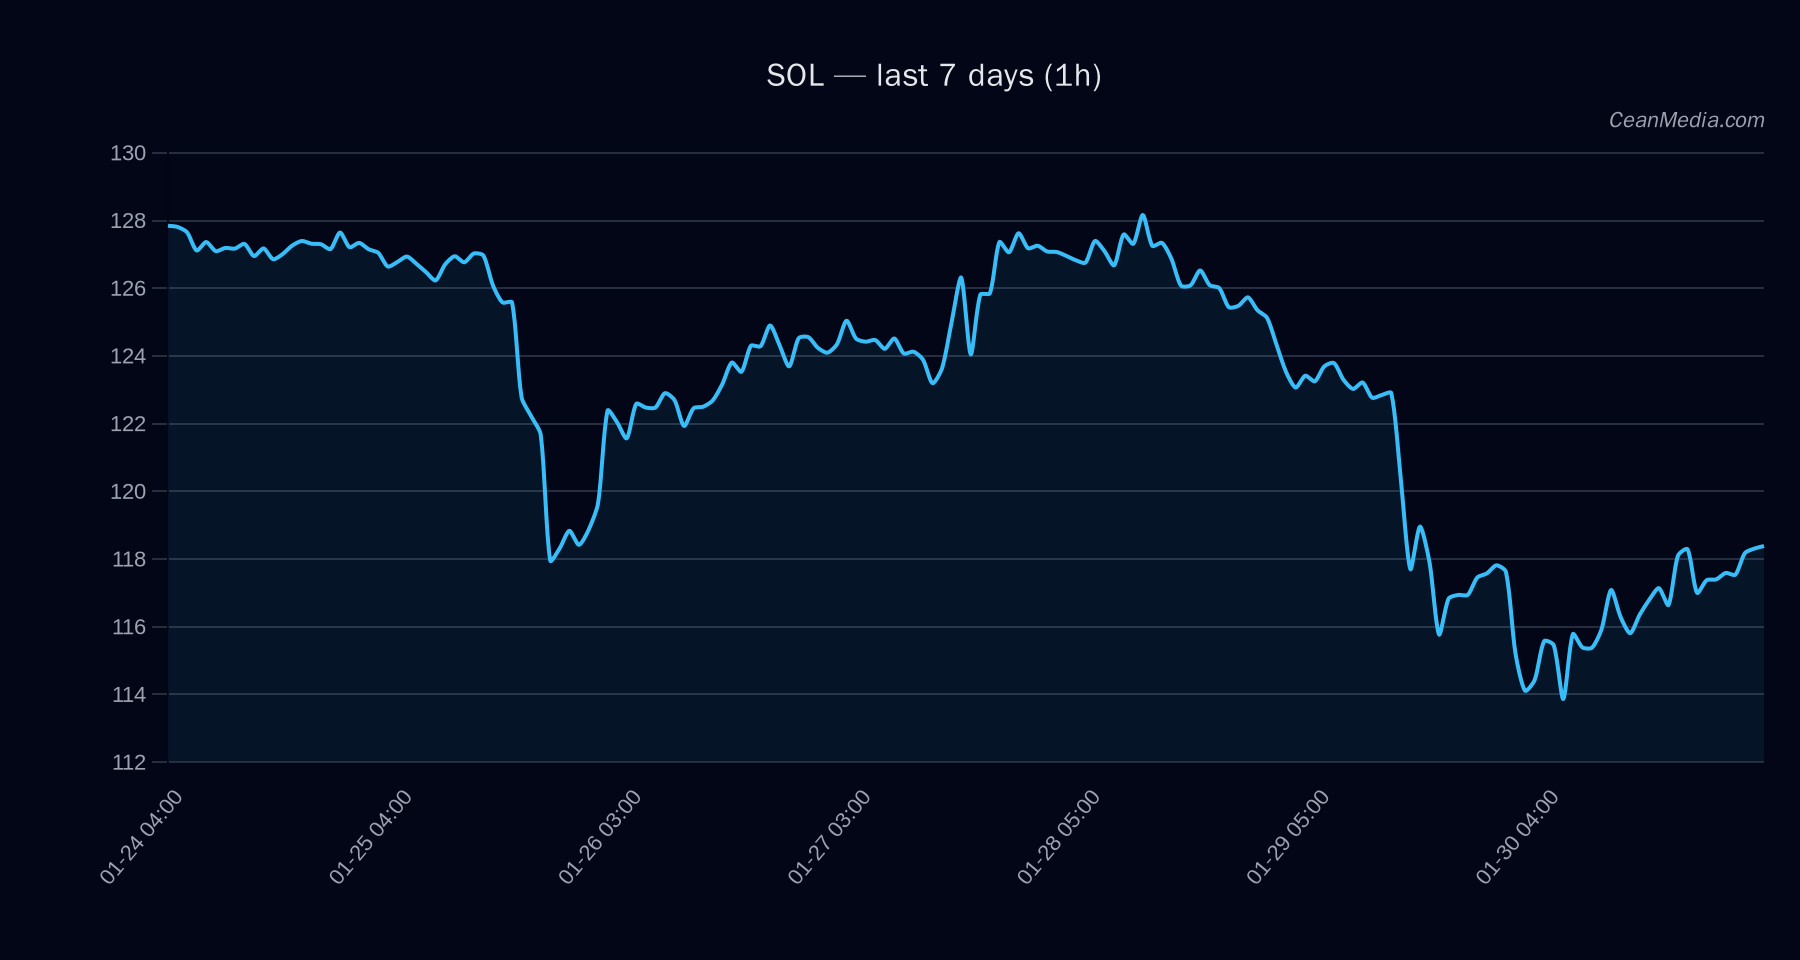
As of January 31, 2026, Solana (SOL) is trading around $118.57 with a sideways bias. Market sentiment remains cautious with very low volatility and an extreme fear sentiment in broader crypto markets. The Bitcoin ETF flows show mixed signals, with a short-term inflow that could suggest cautious risk appetite, but overall, the market remains subdued.
Technical Analysis: SOL
- Levels: Support at approximately $119 (major), near-term support at $116. Major resistance at $125, with near resistance at $121.
- Bias: Sideways with a slight tilt towards upside if resistance levels are broken convincingly.
- Triggers: A close above $121 could target $123.36–$125.78; a close below $116 may lead to declines toward $113.87–$111.55.
- Invalidation: Failure to sustain above $119 or below $116 could reinforce the current sideways movement.
The technical indicators show EMA12 > EMA26, SMA50 < SMA200, RSI at 57, and very low volatility, indicating a neutral to sideways trend with no immediate directional bias.
Drivers
- Top factors include a modest 24H return of approximately 0.03% and a positive EMA slope of 0.0012, indicating slight upward momentum.
- Market sentiment remains cautious with a Funding Z-Score at -0.27 and a Basis Z-Score at -1.03, signaling slight bearish pressure or lack of strong trend.
- Bitcoin’s 24H return of 0.02% and trend strength of approximately 0.86 support a stable macro crypto environment, though overall volatility remains very low.
- Market breadth remains subdued at 17%, with a 72-hour correlation between BTC and SOL at 0.84, indicating a relatively strong correlation but limited breadth for new directional moves.
ETF Flows (BTC/ETH)
Recent ETF flows show a 1-day inflow of +$15.6M into Bitcoin ETFs, but over 5 and 10 days, outflows dominate with -$527.6M and -$1.87B respectively. Ethereum ETFs have experienced consistent outflows over all periods, totaling -$96.9M (1D), -$80.4M (5D), and -$381.7M (10D).
While these flows primarily relate to BTC and ETH, they serve as a broader risk-on/off indicator. The recent inflow into Bitcoin ETFs suggests some short-term risk appetite, but the overall trend points to cautious or risk-off sentiment, consistent with the low volatility environment.
What to Watch Next
- Watch for a decisive break above $121 to confirm upside potential toward $125.
- Monitor the $116 support level for signs of downside acceleration.
- Keep an eye on broader Bitcoin ETF flows for signs of changing risk appetite, which could influence market sentiment.
- Observe macro and market breadth indicators for signs of increasing volatility or trend shifts.
Note: ETF flow data is only for BTC and ETH and is provided as contextual information, not as a primary trading signal for SOL.
Hashtags: #Solana #CryptoAnalysis #BitcoinETF #MarketUpdate #TechnicalAnalysis #CryptoFlows #RiskOn #RiskOff #SolanaAnalysis #CryptoMarkets #Blockchain #Investing