Market Snapshot
Solana (SOL) is trading near a key resistance around 80.5, with appetite for a breakout to higher levels yet constrained by a nearby major level at 80.5 and a major support around 119/77.4 depending on price action. The instrument is currently showing elevated volatility and an oversold RSI in the near term, suggesting potential for a short-term bid if resistance gives way.
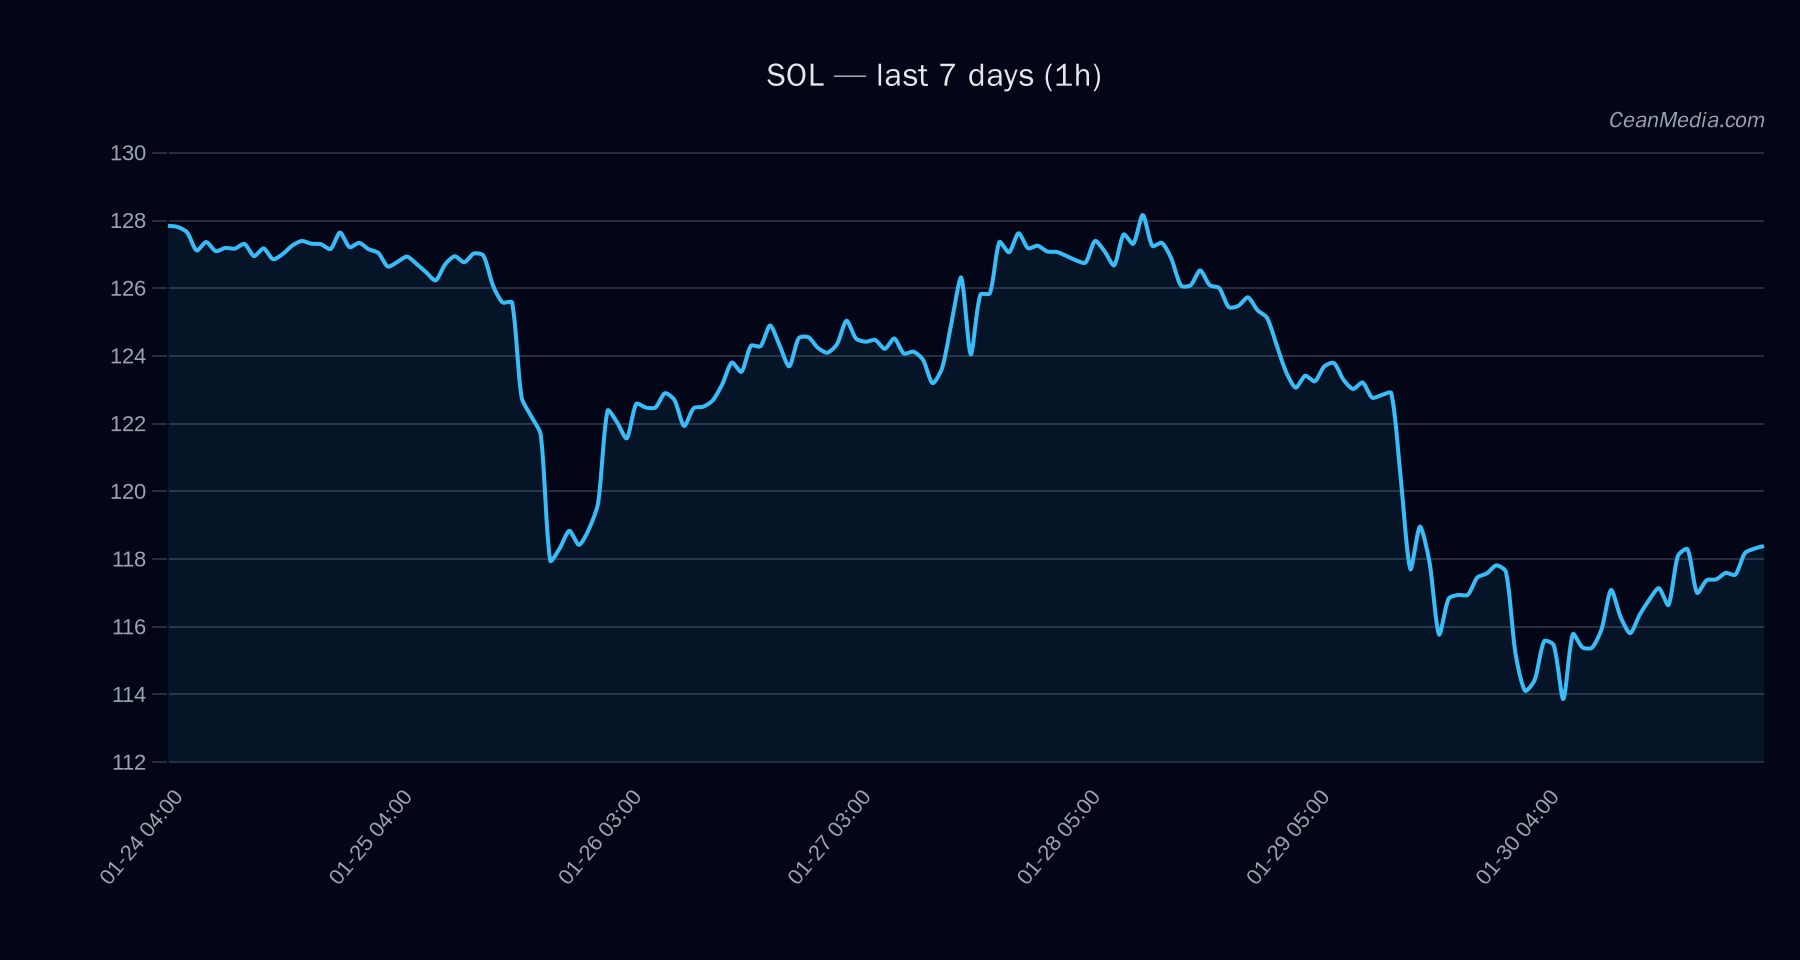
Technical Analysis: SOL
- Current Price: 78.97
- Short-Term Forecast: Up (47% probability)
- Key Levels:
- Near-Term Resistance: 80.5 (Major)
- Major Resistance Target if Break occurs: 82.16 – 87.04
- Near-Term Support: 77.4 (Major)
- Major Support: 119 (contextual/longer-term reference)
- Bias and Indicators: EMA12 < EMA26, SMA50 < SMA200; RSI 9 (oversold); Vol regime: Elevated
- Volatility and Band: P20–P80 Range: 115.11 – 123.46; P50: 119.73
- Invalidation/Tripping Triggers:
- Upside trigger: 1h close > 80.5 to target 82.16–87.04
- Downside trigger: 1h close < 77.4 to target 75.84–70.96
- Forecast Interpretation: Bearish TA signals exist (EMA slope, trend structure), but price action nearing resistance and an oversold RSI condition suggest a possible near-term upside bias if resistance is breached.
Drivers
- Return 24H: 0.03
- EMA Slope: 0.0012
- Funding Z-Score: -0.27
- Basis Z-Score: -1.03
- Order-Book Imbalance (EMA5): -0.0063
- BTC Return 24H: 0.02
- BTC Vol Regime: 0
- BTC Trend Strength: 0.86
ETF Flows (BTC/ETH)
The ETF flow context provided covers BTC and ETH only and should be interpreted as macro sentiment signals rather than SOL-specific drivers. BTC ETFs show negative flows across 1D, 5D, and 10D horizons, indicating risk-off pressure or rotation away from BTC in the near term. ETH ETF flows are also negative at 1D, with larger outflows observed over 5D and 10D periods. This context aligns with a cautious overall risk environment but is not a primary signal for SOL price action.
What to Watch Next
- Watch for a sustained close above 80.5 to validate the upside target of 82.16–87.04.
- Monitor for a break below 77.4 that would shift near-term bias toward the 75.84–70.96 range.
- Keep an eye on volatility regime and RSI behavior as liquidity conditions evolve.
- Correlate with BTC momentum and broader crypto risk appetite, given the ETF flow backdrop for BTC/ETH.
Hashtags: #Solana #SOL #CryptoAnalysis #TechnicalAnalysis #ETFFlows #BTC #ETH #MarketUpdate #CryptoNews #RiskOn #Volatility #TradingStrategies