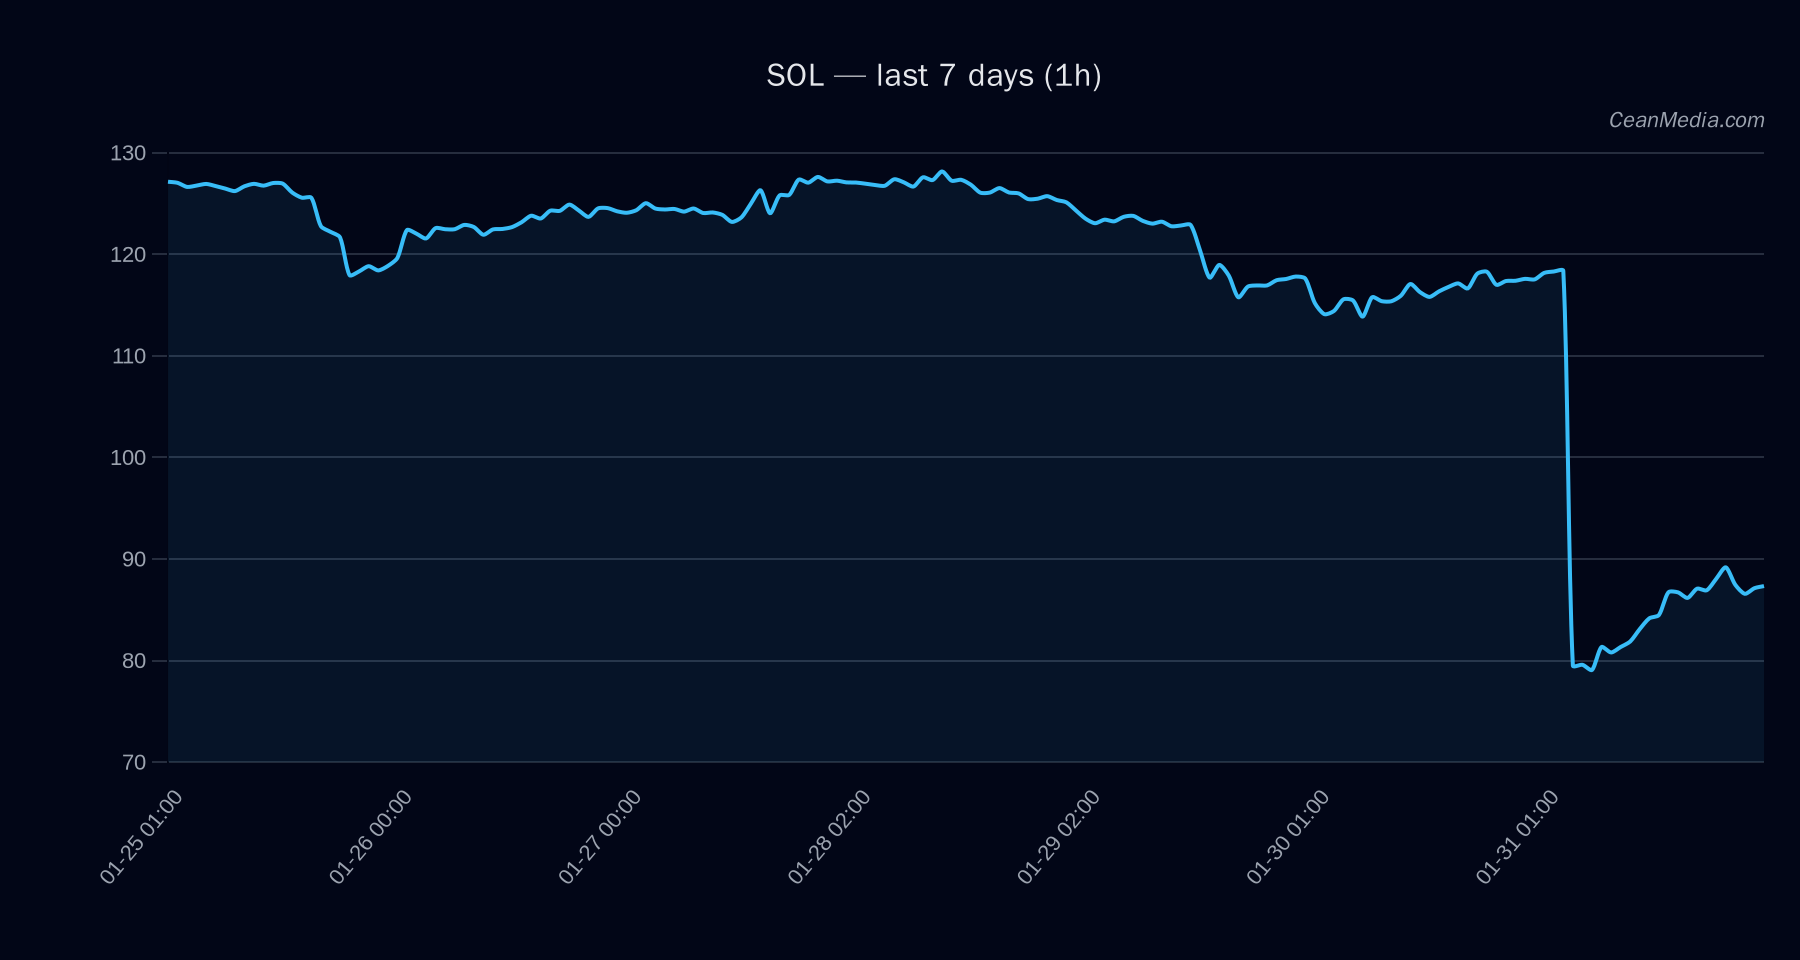
Market Snapshot
On 2026-02-07, SOL trades around the mid-80s to low-90s zone with a 1-hour focal range of 86.3 (support) to 89.8 (resistance). The broader intraday setup indicates elevated volatility with a bearish technical bias despite a relatively modest probability of immediate upside in the near term.
Technical Analysis: SOL
Key levels
- Major support: 114
- Near-term support: 86.3
- Major resistance: 102
- Near-term resistance: 89.8
Bias and triggers
- Forecast: Up (49% probability over the next 24 hours)
- Bias indicators: EMA12 < EMA26, SMA50 < SMA200, RSI 38
- Volatility regime: Elevated
- Break-out trigger: Break above 89.8 targets 91.64–93.44; Break below 86.3 targets 84.59–82.87
Invalidation/considerations
- RSI in the 30s indicates oversold tendencies; however, the trend and moving-average relationship suggest potential for further downside if 86.3 fails with increasing volume.
Support/Resistance context
- Support near 86.3; if breached, next downside range is 84.59–82.87
- Resistance near 89.8; a decisive close above this level could shift the near-term range toward 91.64–93.44
Drivers
- Top factors include EMA slope (-0.0005), funding and basis z-scores (negative)
- Order-book imbalance (EMA5) is negative, suggesting caution in short-term liquidity dynamics
- Volatility regime is Elevated; BTC vol regime indicates higher risk context
- Other momentum indicators show mixed signals with breadth suggesting weak breadth overall
ETF Flows (BTC/ETH)
Contextual note: ETF flow data provided here relates to BTC and ETH only and should be viewed as macro-market context rather than a primary signal for SOL. The BTC ETF shows sizable outflows over 1D, 5D, and 10D horizons, while ETH ETF also displays notable 1D outflows. These flows imply a cautious or risk-off environment in the broader crypto market, which could influence cross-asset correlations and liquidity dynamics for SOL, but do not directly determine SOL’s price trajectory.
What to Watch Next
- Monitor SOL price action near 89.8 for potential upside expansion toward 91.64–93.44 on a breakout with volume
- Watch for a break below 86.3 for confirmation of a downside extension toward 84.59–82.87
- Observe ETF flow momentum in BTC/ETH as a macro risk signal, while maintaining focus on SOL-specific TA (RSI, EMA/SMA relationships)
- Keep an eye on volatility regime signals and order-book depth to assess liquidity risk during sessions of heightened activity
Hashtags: #Solana #SOL #crypto TA #marketanalysis #etfflows #BTC #ETH #riskmanagement #volatility #tradingstrategy #technicalanalysis