DOGE is trading near key support and resistance, with a current price around 0.0917. The near-term forecast leans bearish (down, 66%), with upside probability at 24% and a small probability for sideways movement (~9%). The immediate technical picture features EMA cross bears (EMA12
Contextual breadth indicators show breadth >50h at 0%, BTC-related measures are subdued, and overall market sentiment remains in the Extreme Fear range per F&G index. Currency and BTC/Altcoin interplays imply caution as DOGE approaches the articulated levels.
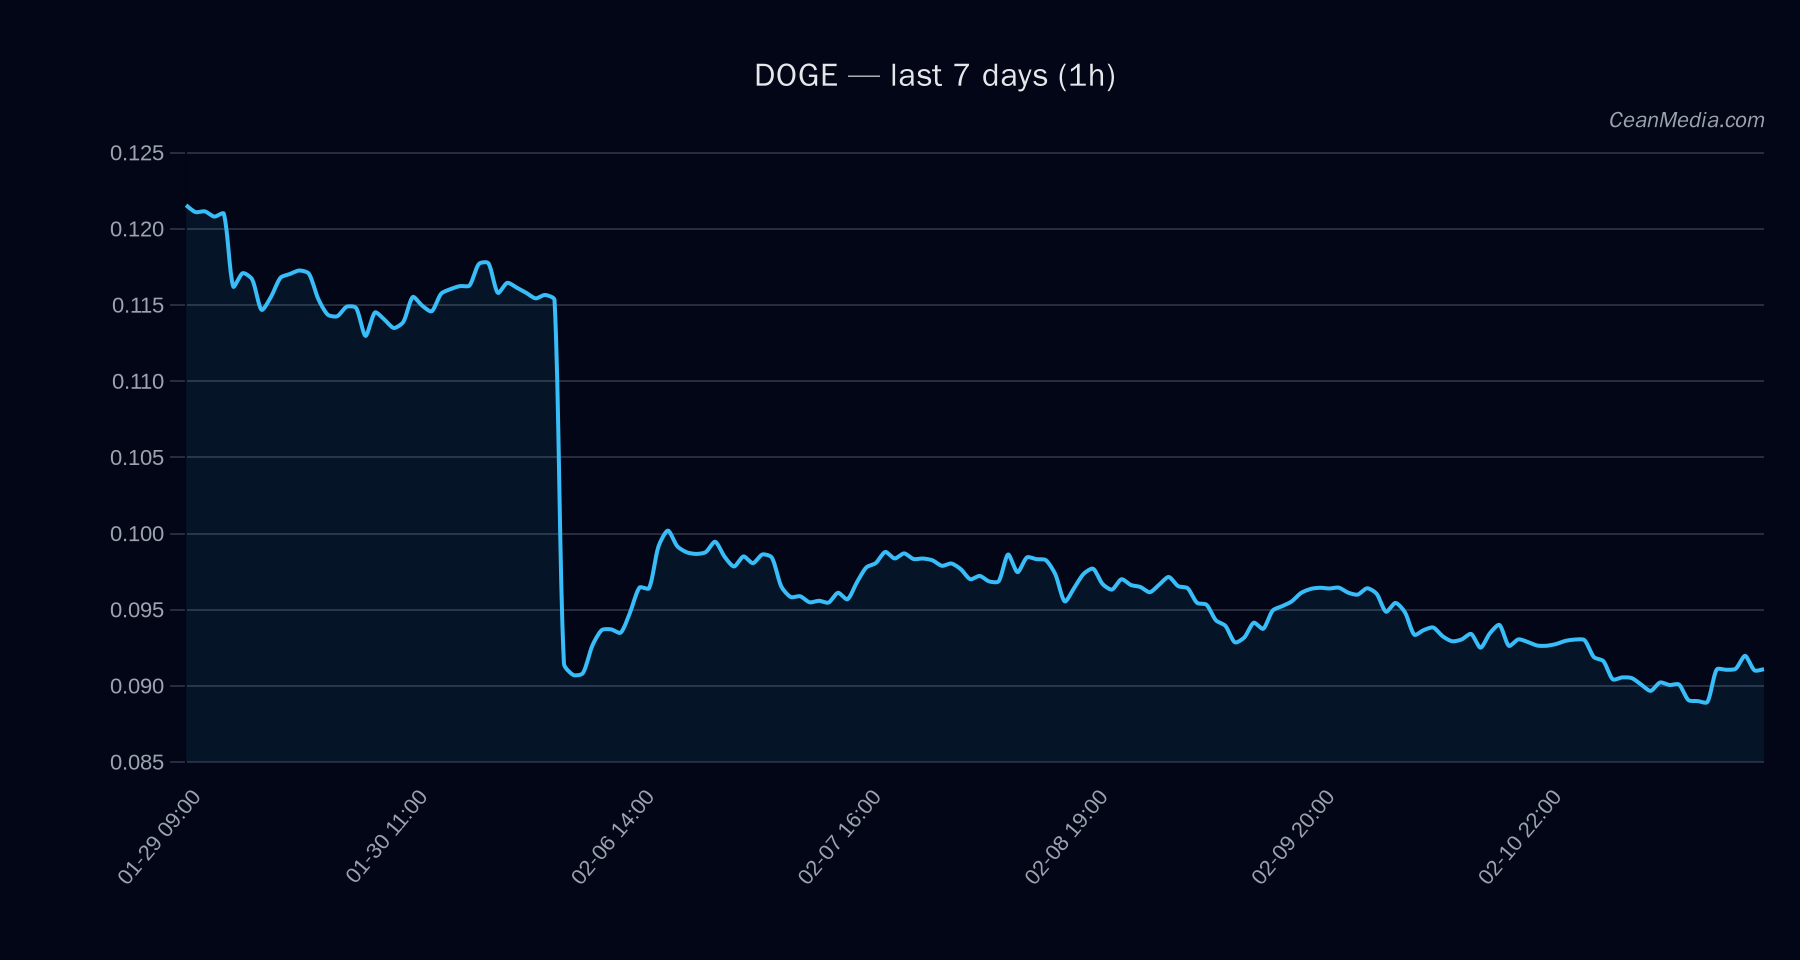
Technical Analysis: DOGE
0.0917
Down (bearish setup)
Support 0.093 (major), 0.09 (near); Resistance 0.1 (major), 0.094 (near)
Volatility and breadth show very low regime with breadth <50h (0%), contributing to the narrow trading range
ETF Flows (BTC/ETH)
The ETF flow data provided is limited to BTC and ETH and is presented here as market context rather than a primary signal for DOGE. The data shows notable ETF inflows for BTC and mixed signals for ETH across different time horizons, which can influence overall risk sentiment and correlated assets. Do not use BTC/ETH ETF flows as a standalone DOGE indicator.
+$140.0M (1D), +$71.3M (5D), -$856.0M (10D)
+$22.2M (1D), -$9.5M (5D), -$317.3M (10D)
What to Watch Next
Watch for a break above 0.094 to validate a move toward 0.0954–0.0973
Observe if DOGE remains below 0.09; a break under 0.09 targets 0.0881–0.0863
Monitor broader risk-on/risk-off signals from BTC/ETH ETF flows, as they can impact correlation dynamics, even for non-BTC assets
Keep an eye on RSI movement around 53 for any shift toward overbought/oversold extremes in the near term