Market Snapshot
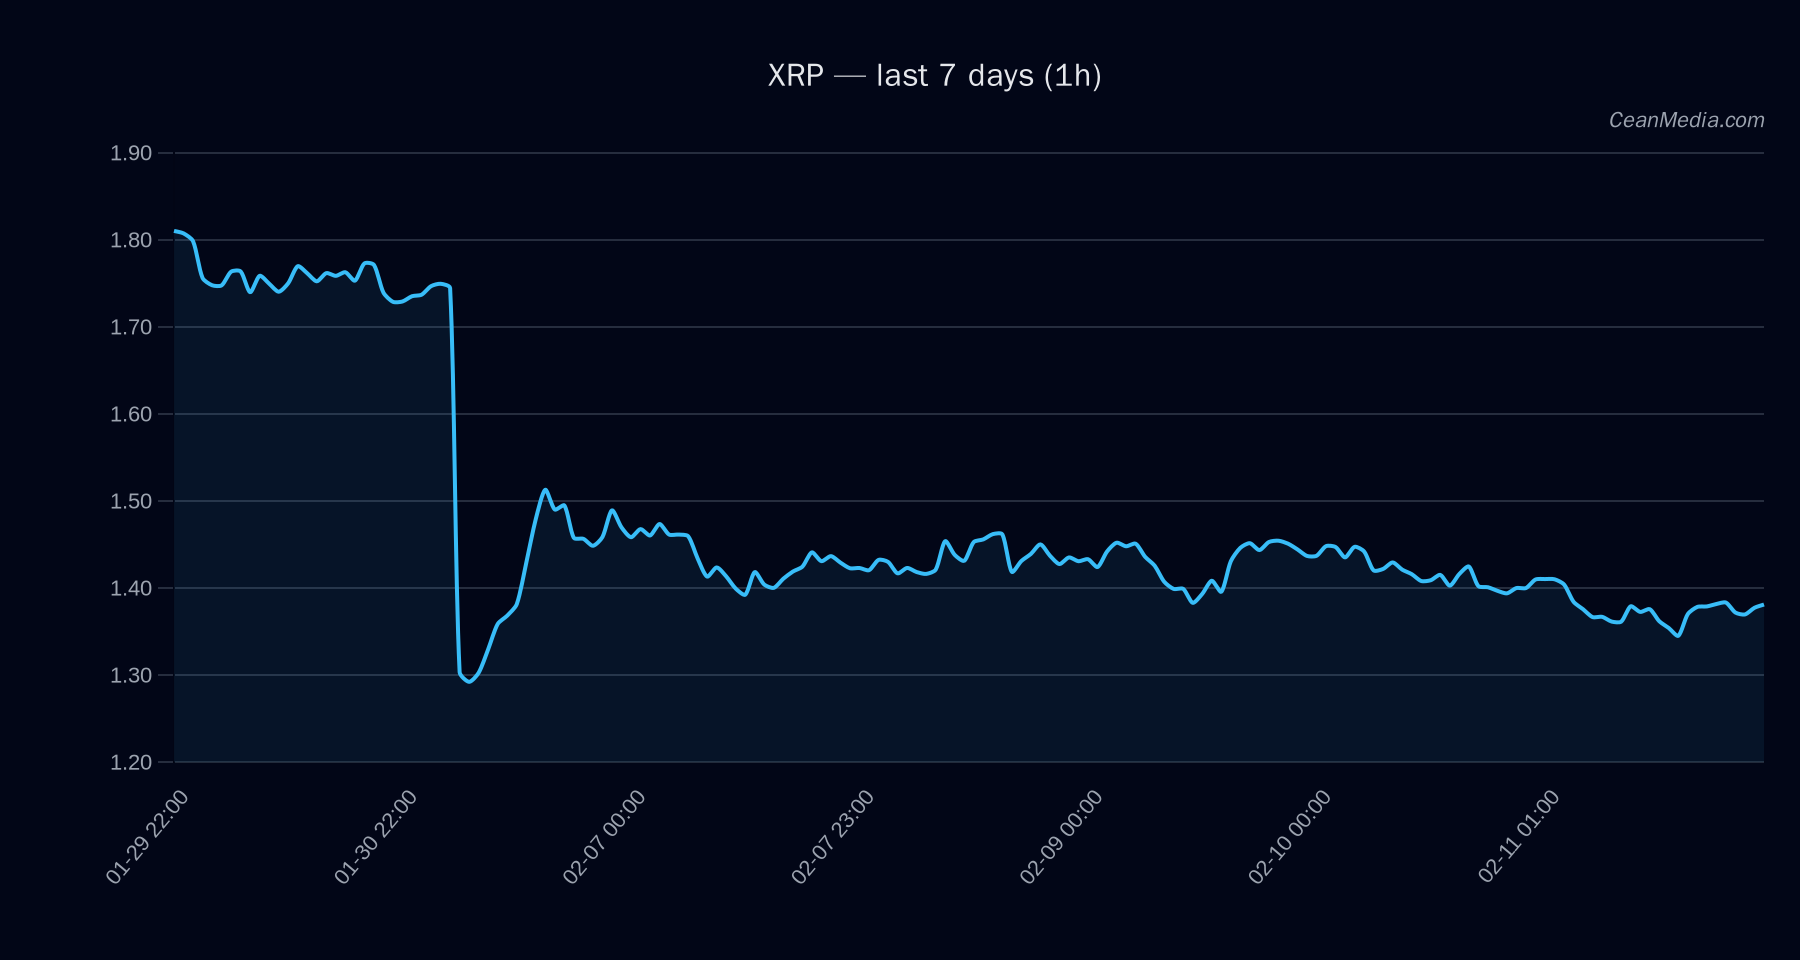
Price: 1.3771. The current short-term forecast for XRP remains bearish with a 53% probability of downside in the next period, while upside is 32% and sideways 15%. The market exhibits low volatility (σ24h 0.69%) and a neutral RSI of 48, with EMA12 < EMA26 and SMA50 < SMA200 indicating bearish-sloped moving averages on the current frame.
Key levels: Support Major at 1.4 (near 1.34), Resistance Major at 1.5 (near 1.4). The P20–P80 band spans 1.3254 to 1.4182. Upside break above 1.4 targets 1.4327–1.4608, while a break below 1.34 targets 1.3226–1.2956.
Technical Analysis: XRP
- Bias: Bearish (short-term down expectation).
- Current setup: EMA12 < EMA26, SMA50 < SMA200, RSI 48.0 — neutral within a low-volatility regime.
- Key levels:
- Support (Major): 1.40
- Support (Near): 1.34
- Resistance (Major): 1.50
- Resistance (Near): 1.40
- Triggers: Break above 1.40 would imply a path toward 1.4327–1.4608; break below 1.34 would imply a path toward 1.3226–1.2956.
- Invalidation: If the price closes decisively above 1.50 on a sustained timeframe, the bearish bias would be challenged; conversely, a sustained close below 1.34 reinforces downside targets.
Drivers
- Return 24h: -0.02
- EMA slope: +0.0008
- Funding Z-score: 0.89
- Basis Z-score: 0.22
- Order-book imbalance (EMA5): 0.05
- BTC Return 24h: -0.02
- BTC Volatility Regime: 0 (low)
- BTC Trend Strength: 0.61
Context: Market breadth readings and crypto-wide indicators show a very low volatility environment with extreme fear signals noted in broader sentiment (F&G: 5). Altcoin breadth excluding mega-cap remains negative, while BTC.D sits near 56.7% and trending slightly lower.
ETF Flows (BTC/ETH)
Contextual note: ETF flow data presented here pertains only to BTC and ETH and should be considered as macro-market context rather than a primary signal for XRP. The BTC ETF has shown positive inflows across 1D (+$140.0M), 5D (+$71.3M), and 10D (-$856.0M). ETH ETF has been positive in 1D (+$22.2M) but negative over 5D (-$9.5M) and 10D (-$317.3M).
- BTC ETF: 1D +$140.0M | 5D +$71.3M | 10D -$856.0M
- ETH ETF: 1D +$22.2M | 5D -$9.5M | 10D -$317.3M
Interpretation: ETF flows indicate a mixed risk-on/off backdrop for BTC/ETH, with short-term inflows suggesting selective risk appetite in Bitcoin on a daily basis, while longer horizons show substantial outflows. For XRP, ETF data is not a direct signal but provides macro context for risk sentiment impacting liquidity and correlations across the market.
What to Watch Next
- Watch for a close above 1.40 to confirm a potential pullback toward 1.4327–1.4608 in the near term.
- Monitor a break below 1.34 for confirmation of continued bearishness toward 1.3226–1.2956.
- Maintain awareness of BTC/ETH ETF flow shifts as a broader risk-on/off backdrop that may influence XRP through correlation and liquidity channels.
- RSI remains neutral; any sustained move above/below key levels could signal a shift in momentum.
Hashtags: #XRP #CryptoAnalysis #TechnicalAnalysis #ETFFlows #BTC #ETH #MarketWatch #PriceAction #Liquidity #Risk sentiment #Altcoins #MarketStructure