Market Snapshot
Cardano (ADA) is trading around the 0.27 level against a backdrop of very low volatility and mixed momentum signals. The near-term view remains tilted to the downside with a 50% forecast, while the immediate range remains bounded between 0.26 and 0.28. Broad market indicators show subdued breadth and a neutral RSI stance near 69, suggesting limited immediate momentum for large directional moves.
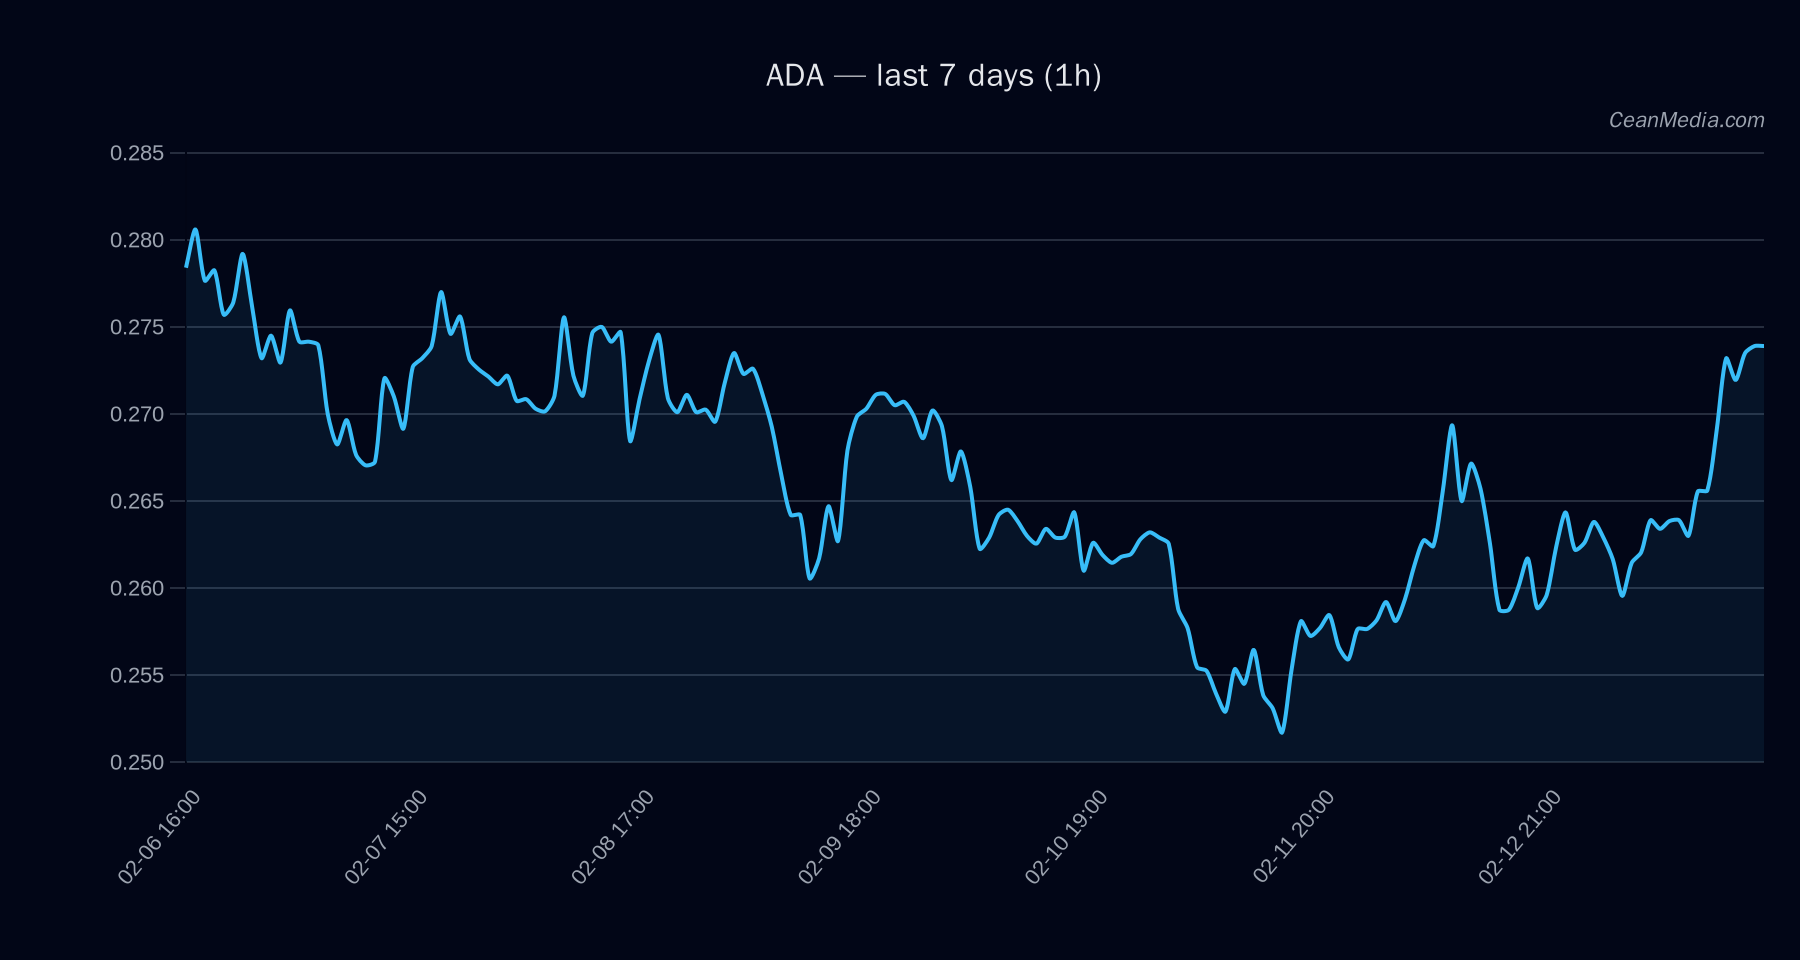
Technical Analysis: ADA
Current price: 0.2734
- Bias: Down (short-term, 50% forecast)
- Probabilities: Up 39% | Sideways 11% | Down 50%
- Key indicators: EMA12 > EMA26, SMA50 < SMA200, RSI 69
- Volatility regime: Very low; σ24h 0.67%
- Band and targets: P20–P80 0.2554–0.2763; P50 0.2566
- Support / Resistance: Major support 0.26, Near support 0.27; Major resistance 0.30, Near resistance 0.28
Forecast and thresholds: Break above 0.28 implies potential move to 0.2844–0.29; break below 0.27 implies potential move to 0.2626–0.2572. Overall forecast remains sideways-to-down given the current technical configuration.
Drivers
- RETURN 24H: 0.06
- EMA SLOPE: 0.0035
- FUNDING Z-SCORE: 0.28
- BASIS Z-SCORE: 0.98
- ORDER-BOOK IMBALANCE (EMA5): 0.05
- BTC RETURN 24H: 0.05
- BTC VOL REGIME: 0
- BTC TREND STRENGTH: 2.12
Contextual breadth signals indicate a cautious stance with overall neutral price momentum. The currency pair’s direction is modestly influenced by broader BTC dynamics but remains primarily governed by its own price action within a tight range.
ETF Flows (BTC/ETH)
The ETF flow data provided covers BTC and ETH rather than ADA. This information should be treated as contextual risk-on/off signals for the broader crypto market rather than a direct signal for ADA. Recent figures show:
- BTC ETF: 1D -$276.3M | 5D -$33.5M | 10D -$1.13B
- ETH ETF: 1D -$129.1M | 5D -$111.4M | 10D -$449.1M
Interpretation: The persistent outflow from BTC ETFs over multiple horizons suggests cautious risk sentiment in the market. If risk aversion rises, downside pressure could spill into altcoins, including ADA, via liquidity shifts. Conversely, stable or improving BTC/ETH ETF flows may support broader risk appetite. This is context rather than a primary ADA signal.
What to Watch Next
- Watch for a sustained break above 0.28 to validate a potential move toward 0.2844–0.29.
- Monitor if ADA breaks below 0.27 to assess risk of a move toward 0.2626–0.2572.
- Keep an eye on BTC ETF flow trends as potential mood indicators for the crypto market, while maintaining ADA-specific bias grounded in its own technicals.
- RSI remains near neutral territory; confirm momentum with a sustained move through the 0.28 resistance or a meaningful expansion in volatility.
Hashtags: #ADA #CryptoAnalysis #TechnicalAnalysis #BTCFlows #ETHFlows #MarketSnapshot #Altcoins