Market Snapshot
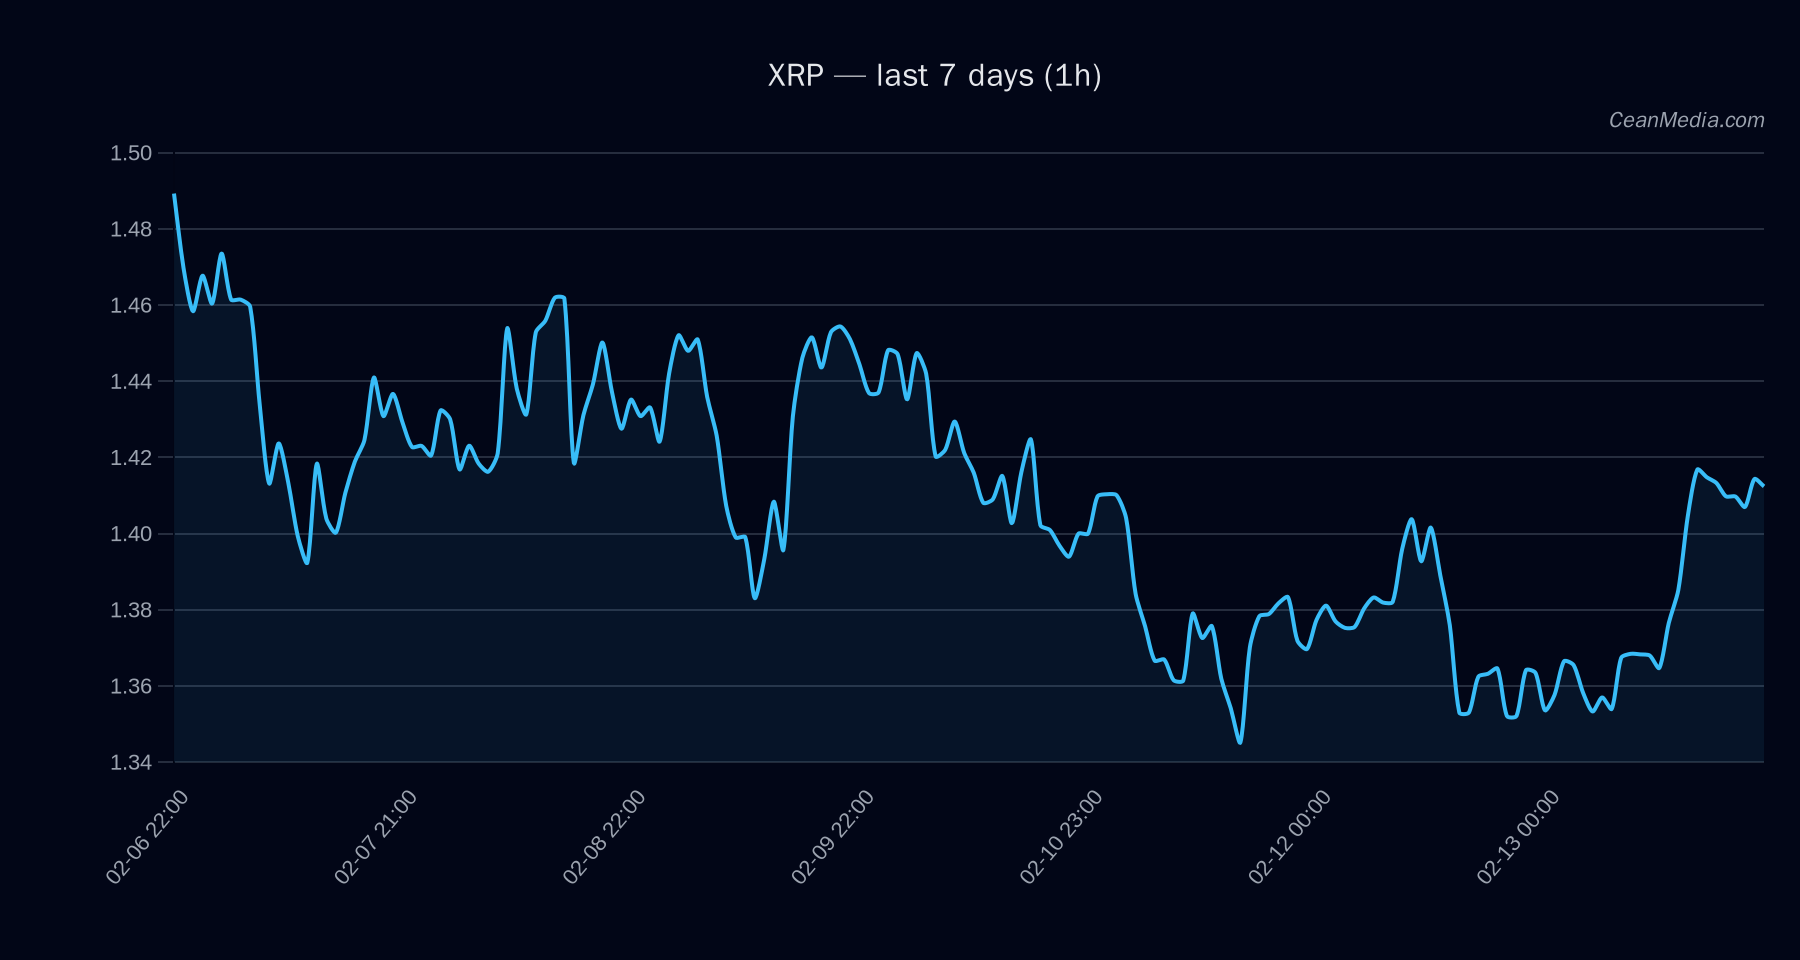
On 2026-02-14, XRP traded around the 1.41 level with a short-term bias for downside. The instrument is currently navigating a tight range between key support and resistance, while broader market signals reflect very low volatility and mixed breadth readings.
Technical Analysis: XRP
Current price: 1.4153
Short-term forecast: down (50%).
Key levels:
- Support (Major): 1.38
- Support (Near): 1.38
- Resistance (Near): 1.44
- Resistance (Major): 1.56
Band and momentum context:
- Band (P20–P80): 1.3359 – 1.4576
- RSI: 68
- EMA12 > EMA26; SMA50 < SMA200
- Vol regime: Very low
Forecast parameters:
- Upside if 1h close > 1.44: 1.4725 – 1.5014
- Downside if 1h close < 1.38: 1.3593 – 1.3315
Bias: Sideways with a downward pressure tendency in the near term.
Invalidation points:
- Break above 1.56 would shift to a more constructive scenario, reducing downside bias.
- Break below 1.38 strengthens the downside trajectory toward 1.33–1.36 zone.
Contextual notes:
- Breadth>50h: 100%
- BTC correlation metrics: ρ(BTC, 72h) ≈ -0.09
- Volatility regime: Very low