Market Snapshot
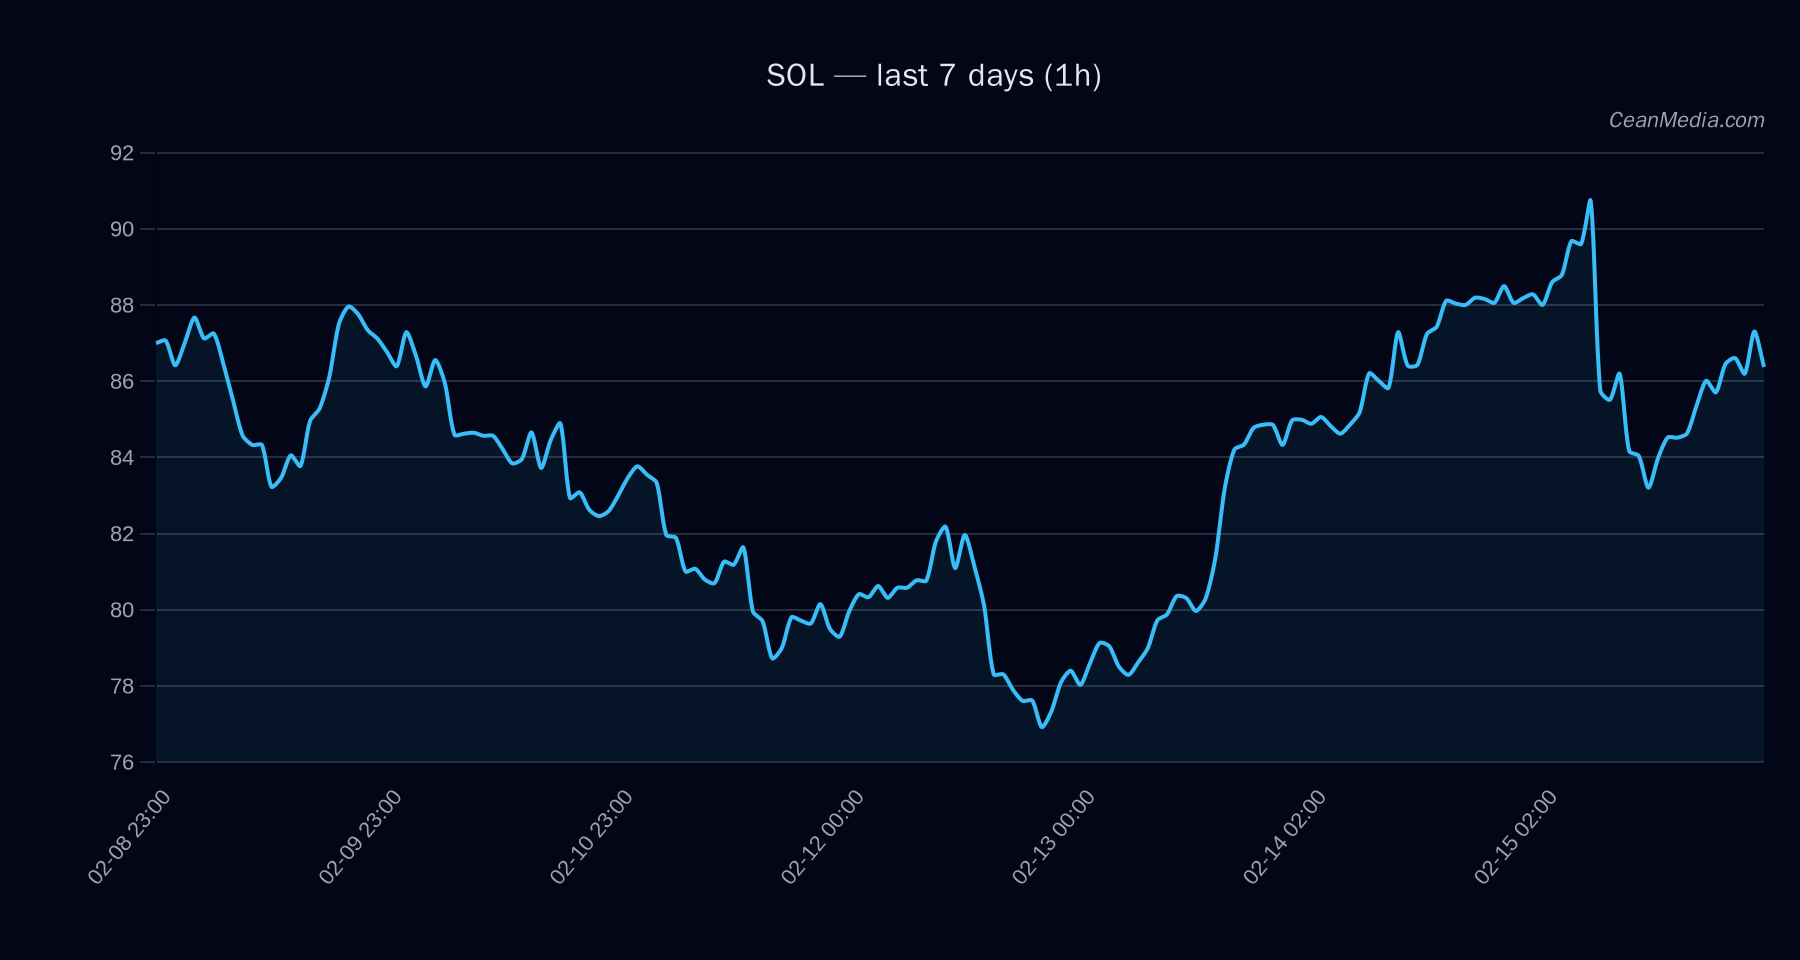
On 2026-02-17, SOL trades around the mid-80s area with a price of approximately 86.38. Near-term bias is down with a 56% probability, while odds of an upside move within the 24-hour horizon sit at 37%. The instrument is currently in a sideways-leaning regime: EMA12 < EMA26, SMA50 > SMA200, RSI at 52, and a low volatility regime (σ24h ≈ 1.40%). The immediate support is indicated at 80.1 (major) and 84.7 (near), with resistance at 94.4 (major) and 88.1 (near).
Key thresholds for intraday action are as follows: a close above 88.1 targets 89.87–91.63; a close below 84.7 targets 82.96–81.27. The 20th–80th percentile band sits between 77.78 and 87.01, with the P50 around 83.43.
Technical Analysis: SOL
86.38 Down (56%) EMA12 < EMA26, SMA50 > SMA200, low volatility regime 1h close > 88.1 → 89.87–91.63 1h close < 84.7 → 82.96–81.27
Drivers
- EMA Slope: 0.0006
- Funding Z-Score: 0.90
- Basis Z-Score: 1.10
- Order-Book Imbalance (EMA5): 0.052
- Vol Regime: Low
- Distance from MA: 1.31%
- Other signals: 7-day drawdown of -0.41 (contextual), 7-day breakout factor of -0.048
ETF Flows (BTC/ETH)
Notes: ETF flow data provided here is context only and reflects BTC and ETH ETFs. This information is not a primary signal for SOL. The flows indicate risk-on or risk-off sentiment in broader markets, which can influence crypto sentiment subtly but should not be used in isolation to infer SOL-specific moves.
- BTC ETF: +$15.1M (1D), +$415.7M (5D), -$611.8M (10D)
- ETH ETF: +$11.7M (1D), -$21.8M (5D), -$334.4M (10D)
What to Watch Next
- Monitor close above 88.1 to validate a potential upside continuation toward 89.87–91.63.
- Watch for a close below 84.7 to confirm renewed downside risk toward 82.96–81.27.
- Keep an eye on volatility regime shifts; a move out of the current low regime could precede sharper price action.
- Consider how BTC/ETH ETF flows correlate with broader risk sentiment, while maintaining SOL-specific levels and indicators as the primary framework.
Hashtags: #Solana #SOL #CryptoAnalysis #TechnicalAnalysis #ETFFlows #BTC #ETH #MarketSentiment #CryptoNews #SolanaPrices #PriceForecast #TradingStrategy