Market Snapshot
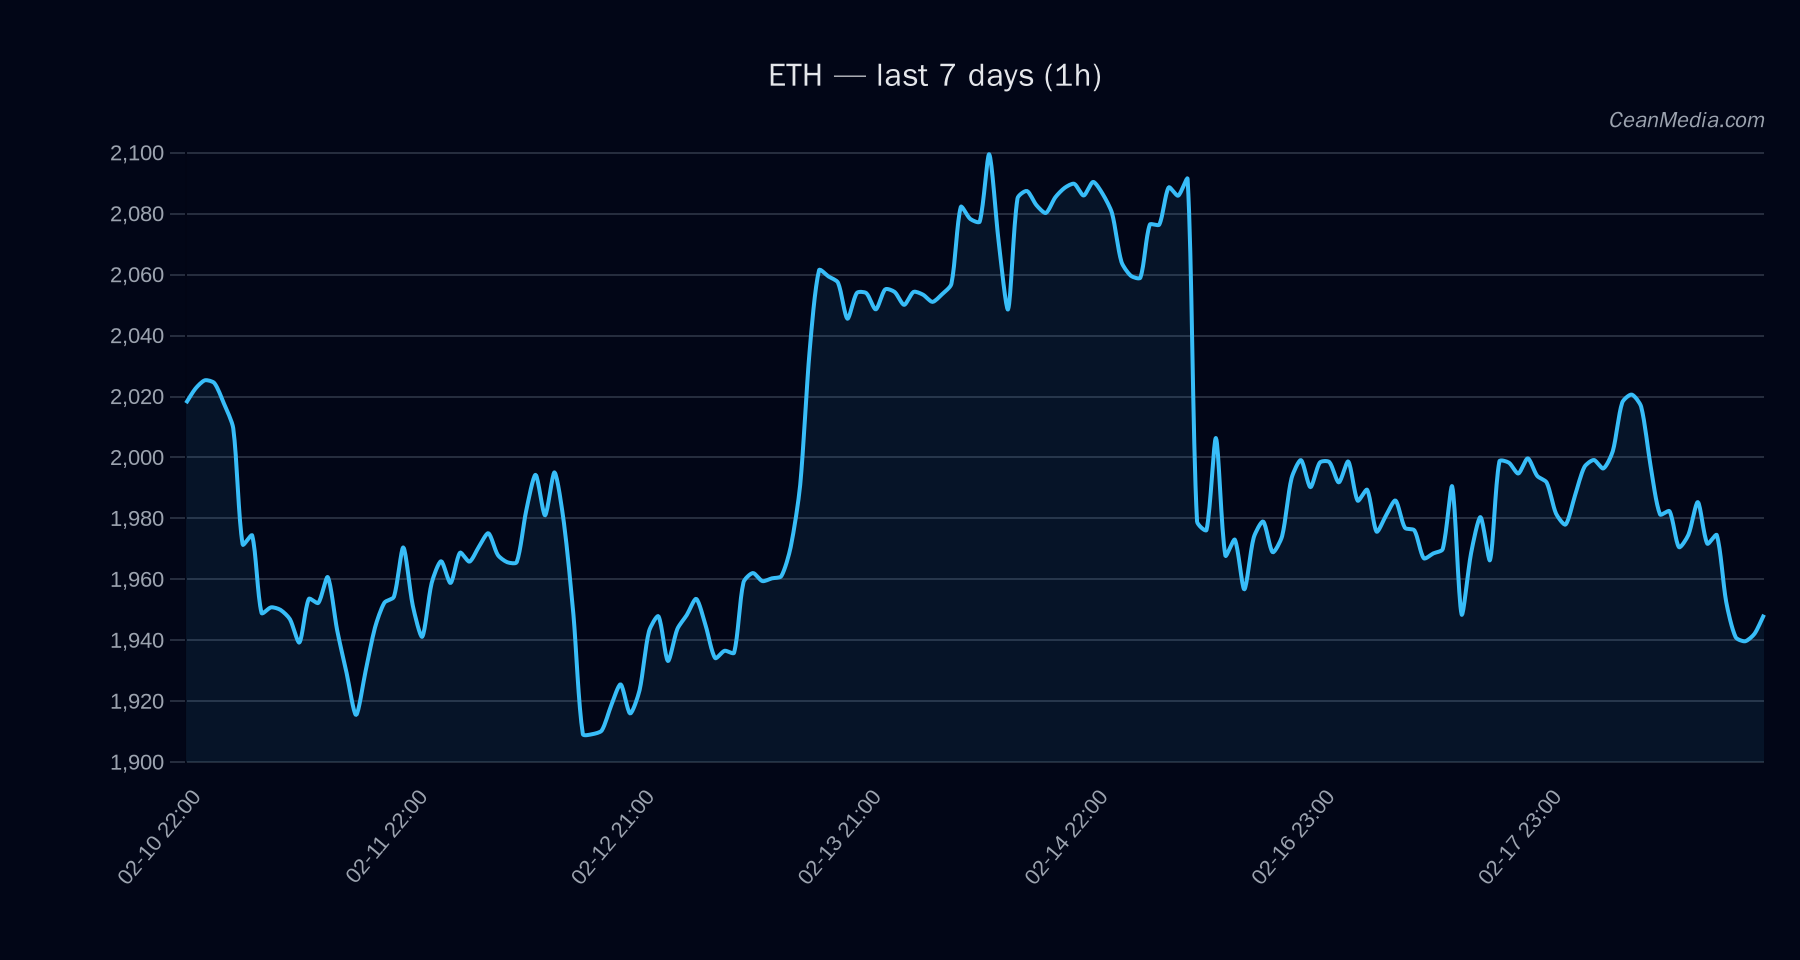
Ethereum (ETH) is trading around the mid-to-upper 1,900s with today’s price near 1,958.08. The market shows a bearish tilt in the near term, supported by EMA/MA alignment and a subdued RSI. ETF flows data provided for BTC and ETH should be treated as contextual as part of broader market sentiment rather than a direct ETH trading signal.
Technical Analysis: ETH
: 1,958.08 : Down (47% probability of downside in the near term). RSI 43 indicates neutral momentum but below midpoint. : - EMA12 < EMA26 (bearish)
- SMA50 < SMA200 (bearish)
- Volatility (σ24h) 0.52% with very low regime
: - P20–P80: 1,926.12 – 2,047.60
- Near-term support: 1,918; Major support: 1,948
- Near-term resistance: 1,998; Major resistance: 2,104
: - Upside trigger: 1h close > 1,998 → potential move toward 2,037.19 – 2,077.13
- Downside trigger: 1h close < 1,918 → potential move toward 1,880.54 – 1,842.16
Drivers
- Return 24h: -0.02%
- EMA slope: -0.0012 (bearish)
- Funding z-score: -0.06 (minor bearish pressure)
- Basis z-score: -1.96 (bearish deviation from moving averages)
- Order-book imbalance (EMA5): -0.16 (slightly bearish order flow)
- BTC Return 24h: -0.02%
- BTC volatility regime: very low
- BTC trend strength: 0.78 (moderate positive signal for BTC, mixed implications for ETH)
ETF Flows (BTC/ETH)
Context: ETF flow data is provided for BTC and ETH and is intended to reflect broader market participation rather than a sole ETH trading signal. The data is not a primary driver for ETH pricing but helps frame risk-on/off sentiment.
: +$14.8M (1D), +$59.4M (5D), -$87.3M (10D) - ETH ETF: +$27.9M (1D), +$34.7M (5D), -$42.3M (10D)
What to Watch Next
- Key level break above 1,998 with sustained closes could open toward 2,037–2,077 in the short term.
- Failure to hold 1,918 could invite a test of 1,880–1,842 in a bearish scenario.
- Close observation of EMA/MA crossovers: continued EMA12 < EMA26 and SMA50 < SMA200 would maintain a bearish bias.
- Contextual ETF flows should be monitored as part of overall market breadth but not used as a direct ETH price signal.
Hashtags: #ETH #Ethereum #TechnicalAnalysis #MarketSnapshot #ETFFlows #CryptoNews #PriceAction #MAAnalysis #RSI #ETFInsights #BTCvsETH