Market Snapshot
BTC remains range-bound between the key support at 66,425 and resistance at 69,150. The near-term bias is described as sideways with a down-leaning forecast probability (~53% for downside) given the current technical setup. Market breadth indicators show broad participation with a 100% breadth >50h, but overall volume regime is very low, suggesting subdued intraday activity.
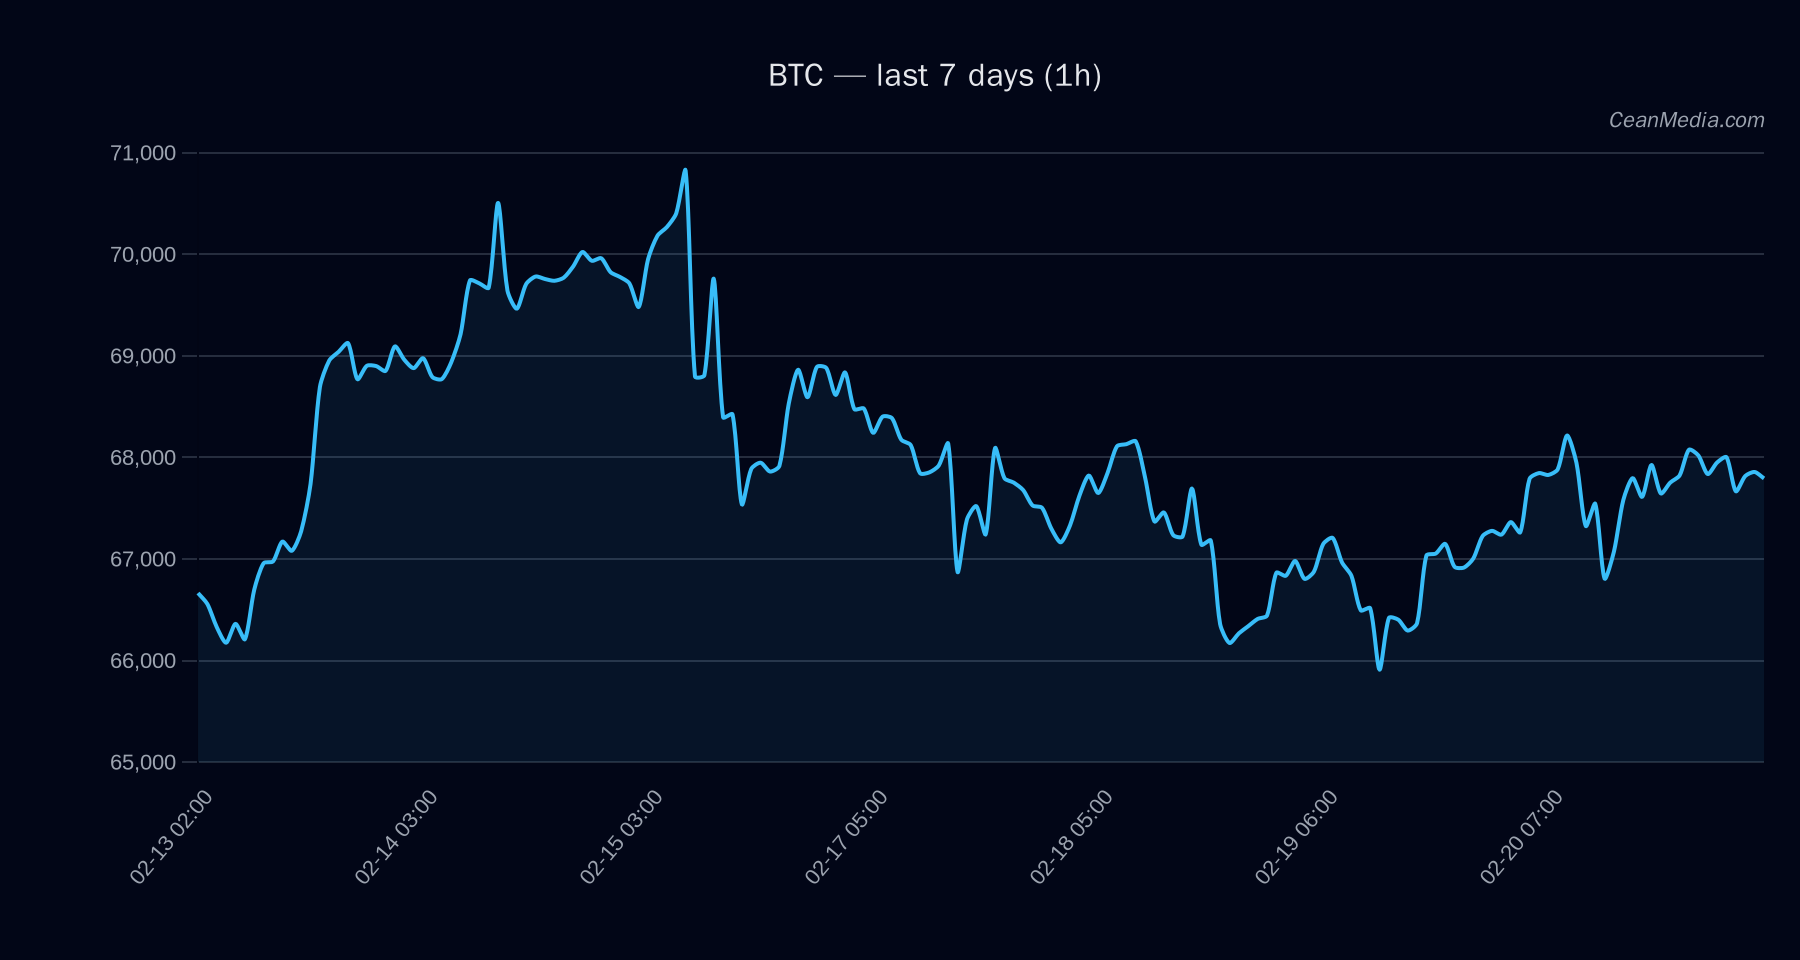
Technical Analysis: BTC
- Price: 67,785.79
- Bias / Forecast: Down (53%); Sideways/tendency supported by EMA12>EMA26, SMA50
- Support: Major 66,700; Near 66,425
- Resistance: Major 71,050; Near 69,150
- Key levels on momentum: Break above 69,150 signals potential to 70,524–71,907; Break below 66,425 targets 65,101–63,773
- Band: P20–P80 66,185.79 – 69,967.36
- Top indicators: Return 24h ~0.1%, EMA slope near zero, Funding Z-Score ~1.21, Basis Z-Score ~1.23, Order-book imbalance (EMA5) ~0.155
- Volatility / regime: σ24h ~0.43%, Vol regime: Very low
- Intra-day trigger (upside): 1h close > 69,150 → target 70,524.34–71,907.17
- Intra-day trigger (downside): 1h close < 66,425 → target 65,101.47–63,772.87
Drivers
- Return 24H: ~0.1%
- EMA Slope: ~0.00012 (neutral)
- Funding Z-Score: ~1.21
- Basis Z-Score: ~1.23
- Order-book Imbalance (EMA5): ~0.155
- BTC Return 24H: ~0.1%
- BTC VOL REGIME: -1 (low/declining volatility)
- BTC Trend Strength: ~0.046
ETF Flows (BTC/ETH)
Contextual ETF flow data is provided for BTC and ETH only. This information is supplementary and should not be used as a primary signal for BTC price action. Recent data show:
- BTC ETF: +$23.6M (1D); -$161.4M (5D); -$194.9M (10D)
- ETH ETF: +$1.2M (1D); -$93.2M (5D); -$204.6M (10D)
Interpretation: The latest 1-day BTC ETF flow is positive, while longer-dated flows are negative, suggesting mixed near-term demand within ETF instruments. This ETF context indicates risk-on/off dynamics rather than acting as a standalone driver for BTC price, and should be assessed alongside traditional market indicators and on-chain signals.
What to Watch Next
- Monitor a daily close above 69,150 for potential breakout toward 70,524–71,907.
- Watch for a break below 66,425 to validate downside targets near 65,101 and 63,773.
- Track volatility regime shifts, as a move away from the current very low regime could alter short-term dynamics.
- Keep an eye on ETF flow signals in conjunction with macro risk sentiment and broader crypto market breadth (Alt breadth, BTC.D share).
Hashtags: #BTC #Bitcoin #CryptoAnalysis #ETFFlows #TechnicalAnalysis #MarketView #TradingStrategy #RiskManagement #MacroCrypto #CryptoNews #BitcoinPrice #BTCMarket