Market Snapshot
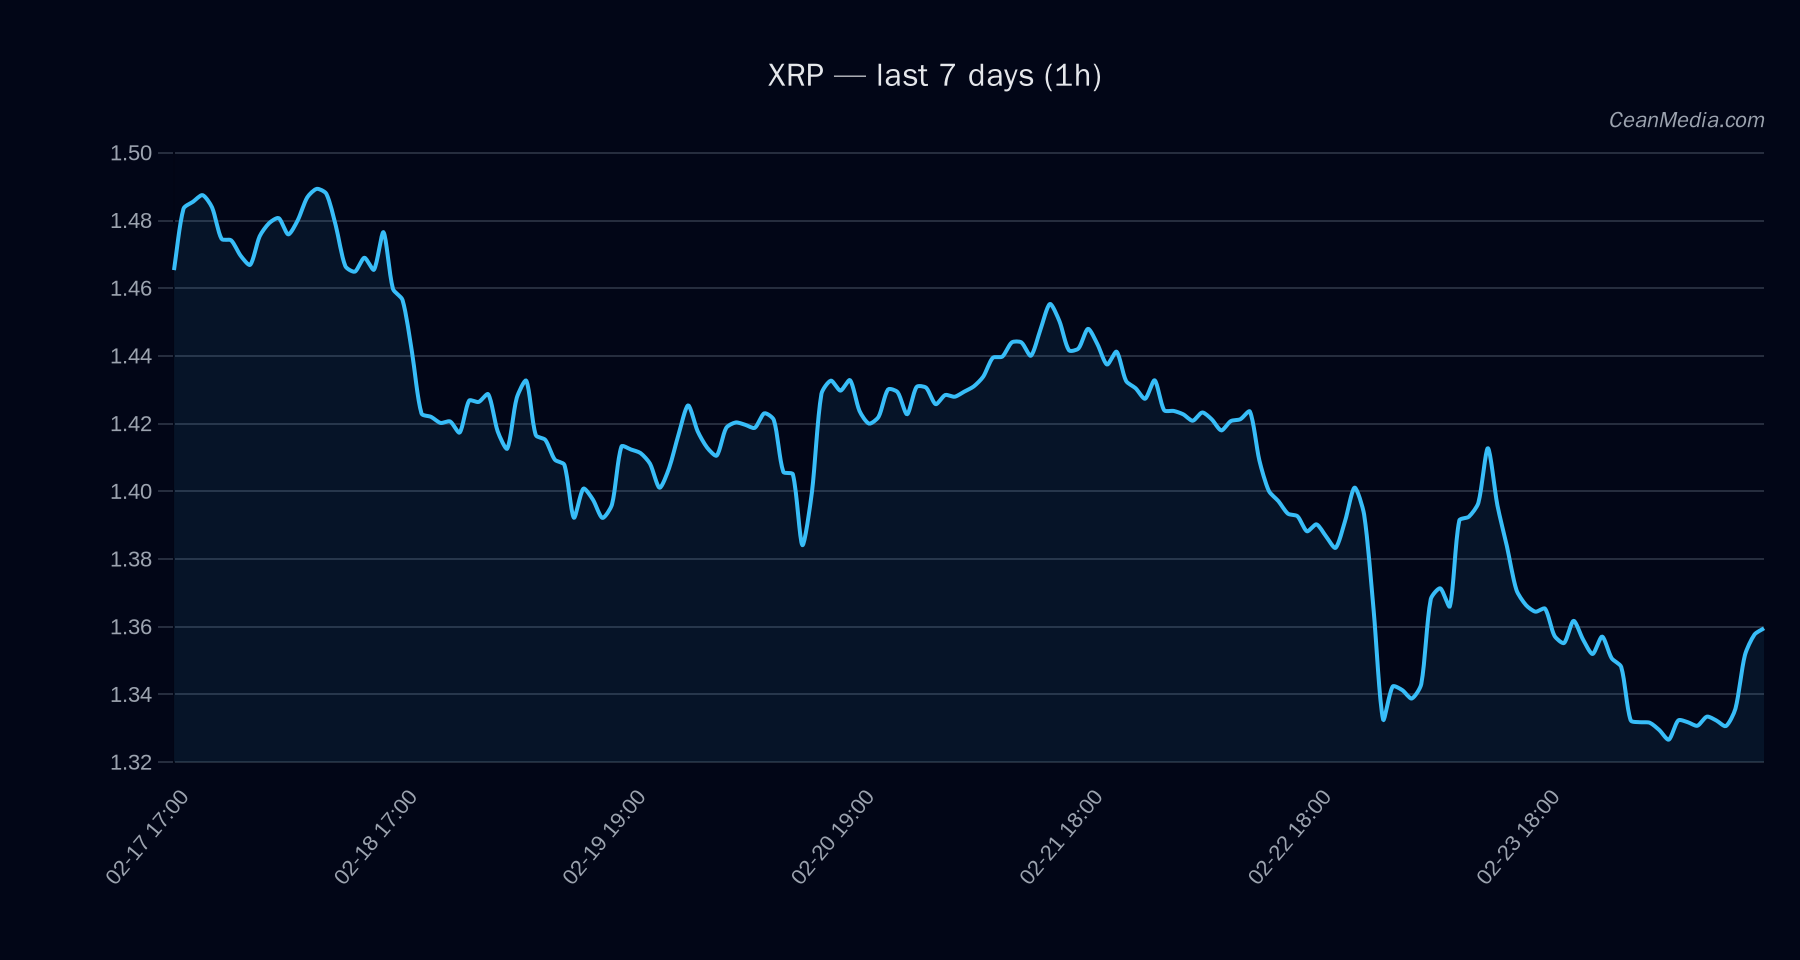
The XRP market remains range-bound between 1.34 support and 1.38 resistance, with a near-term bias aligned to a potential downside if momentum fails to press above resistance. The current price sits around 1.36, placing it near the midpoint of the identified band (P20–P80: 1.3042–1.3646). Overall volatility is described as very low, and breadth indicators suggest a cautious posture in the broader crypto space.
Technical Analysis: XRP
- Current Price: 1.358
- Short-Term Forecast: Down (57%)
- Probability Allocation: Up 34%, Sideways 9%, Down 57%
- Key Indicators: EMA12
- Volatility Regime: Very low (σ24h 0.44%)
- Support (Major/Near): Major 1.36; Near 1.34
- Resistance (Major/Near): Major 1.48; Near 1.38
- Upside Trigger: 1h close > 1.38 → 1.4129…1.4406
- Downside Trigger: 1h close < 1.34 → 1.3042…1.2776
- Forecast Summary: Down 57%; TA: sideways bias due to EMA12
Drivers
- Return 24h: -0.0036
- EMA slope: 0.0021
- Funding z-score: -0.51
- Basis z-score: 1.51
- Order-book imbalance (EMA5): 0.1
- BTC return 24h: -0.0091
- BTC volatility regime: 0
- BTC trend strength: 0.39
ETF Flows (BTC/ETH)
Context: ETF flow data presented here covers BTC and ETH only. These signals are contextual and should not be used as a primary signal for XRP positioning. Current data show mixed-to-negative net flows for BTC across 1D and 5D windows, with modest negative momentum on ETH in the near term. This backdrop can reflect broader risk-on/off dynamics but is not a direct XRP driver.
- BTC ETF: 1D -$78.2M | 5D -$190.2M | 10D +$225.5M
- ETH ETF: 1D +$3.9M | 5D -$99.2M | 10D -$121.0M
What to Watch Next
- Watch for a close above 1.38 to invalidate the near-term downside bias and target 1.4129–1.4406.
- Break below 1.34 would open a path toward 1.3042–1.2776; monitor liquidity around 1.34 for potential support tests.
- Keep an eye on BTC-ETH ETF flows as a contextual risk-on/off backdrop, recognizing it is not a direct XRP signal.
- Observe changes in RSI and volatility regime for signs of a regime shift from very low to higher activity.
Hashtags: #XRPAnalysis #CryptoMarkets #TechnicalAnalysis #ETFFlows #BTC #ETH #MarketOutlook #PriceAction #SupportResistance #Momentum #Volatility