Market Snapshot
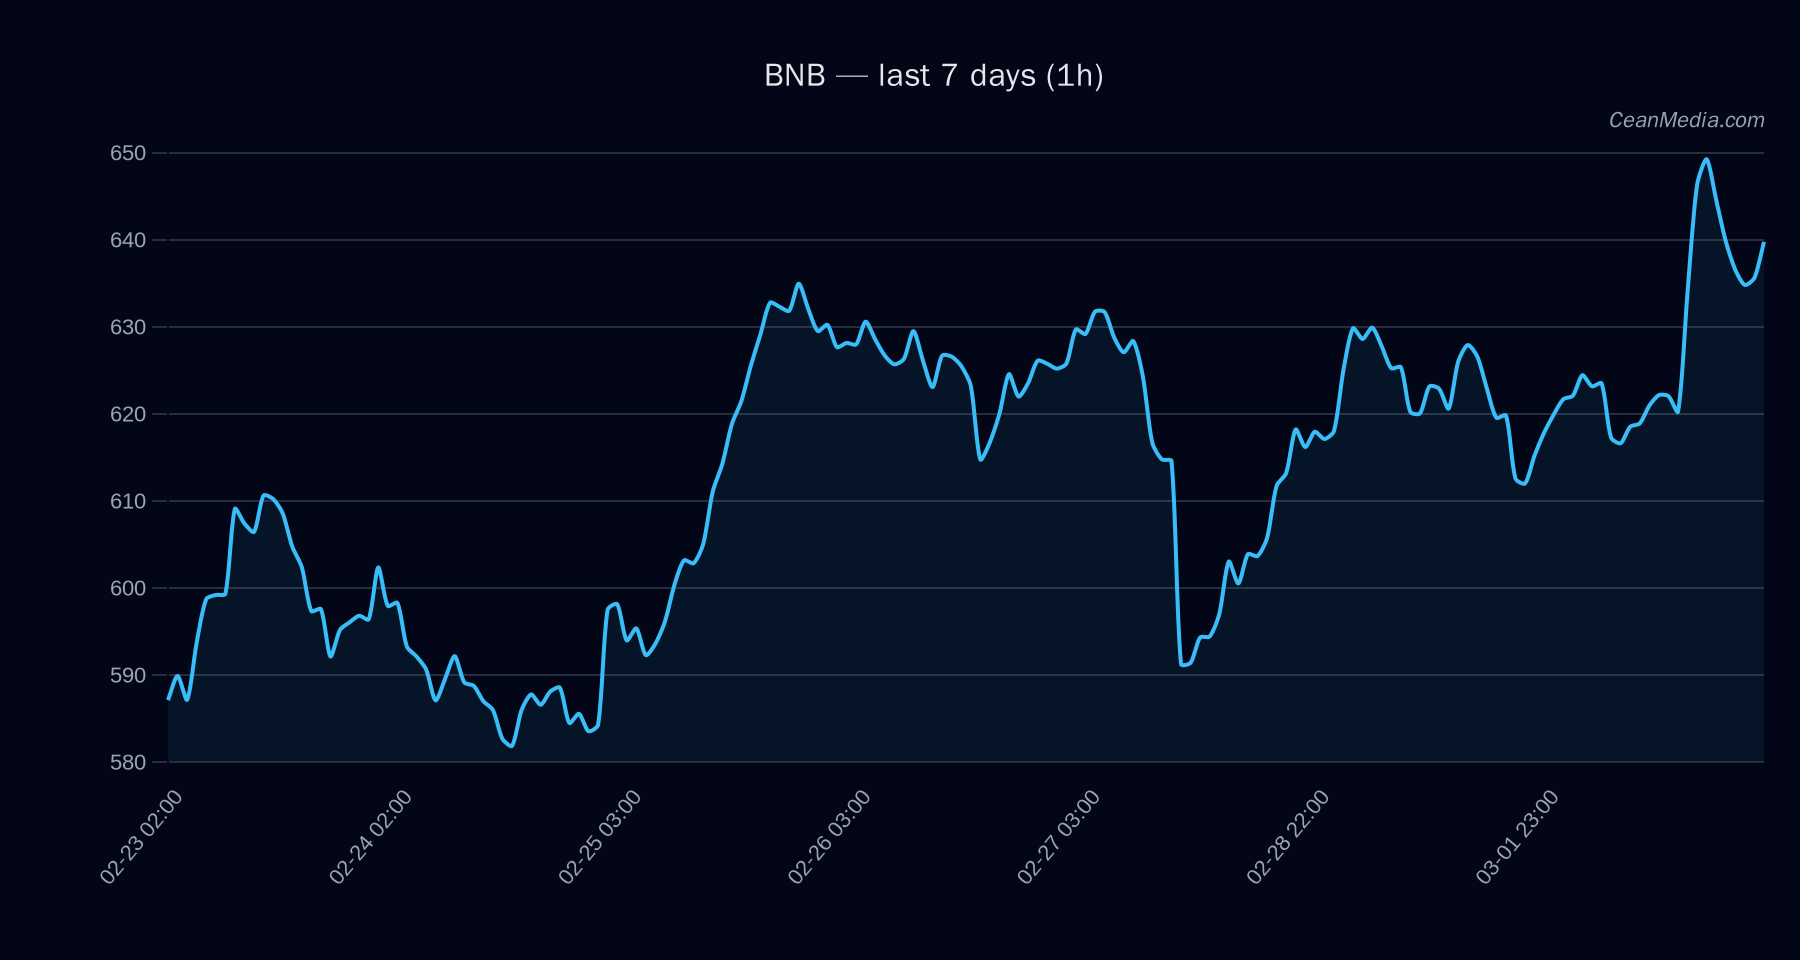
On 2026-03-03, BNB traded around 637.65 with a short-term forecast tilted down (47%). The price sits between a near-term support of 625 and a near-term resistance of 650. Breaks beyond these bands imply potential targets around 663–676 (upside) or 612–600 (downside). Market context shows very low volatility and a mixed breadth environment, with notable 24h return modestly positive and BTC-related signals contributing to a cautious stance for the asset.
Technical Analysis: BNB
637.65 Down (47% probability) with bullish underpinnings from EMA14/EMA26 alignment and price above SMA50 vs SMA200 (EMA12>EMA26, SMA50>SMA200). RSI 60; 1h volatility proxy (σ24h) 0.70%; Volatility regime: Very low 1h close > 650 → 663.41–676.42 1h close < 625 → 612.40–599.90 632.89; Band (P20–P80): 626.86–652.03 EMA slope positive but small (0.00136), Trend strength ~1.43 for BTC, vol and order-book signals in the very low regime
Drivers
- Return 24h: +0.04
- EMA slope: +0.00136
- Funding z-score: +0.058
- Basis z-score: -0.371
- Order-book imbalance (EMA5): +0.215
- BTC return 24h: +0.064
- BTC vol regime: 1 (low to moderate)
- BTC trend strength: ~1.43
- Other context: breadth >50h at 83%; BTC.D ~56.6% and rising; overall market sentiment shown as Extreme Fear (F&G: 14)
ETF Flows (BTC/ETH)
Contextual ETF flow data for BTC and ETH is provided to gauge broader market risk appetite, but it is not a primary signal for BNB. The data indicate recent net outflows in BTC ETFs on the latest 24h, with positive inflows over the 5-day and 10-day windows, suggesting a cautious risk-on/off backdrop rather than a decisive directional cue for BNB specifically. ETH ETF flows show a similar pattern but are distinctly separate from BNB’s technical picture.
- BTC ETF: 1D -$27.5M | 5D +$395.5M | 10D +$298.6M
- ETH ETF: 1D -$41.7M | 5D +$82.2M | 10D -$9.2M
What to Watch Next
- Monitor the 625 near-term support: a break below could accelerate downside toward 612–600.
- Watch for a close above 650 as a potential bullish trigger toward 663–676.
- Keep an eye on BTC signals and volatility regime, as BTC strength/dynamics can influence cross-asset risk sentiment.
- Assess any shifts in breadth and the F&G fear indicator, which may precede a change in momentum for BNB.
Hashtags: #BNB #CryptoAnalysis #TechnicalAnalysis #ETFFlows #BTC #ETH #MarketSnapshot #TradingPlan #CryptoMarkets #Altcoins #PriceAction