Market Snapshot
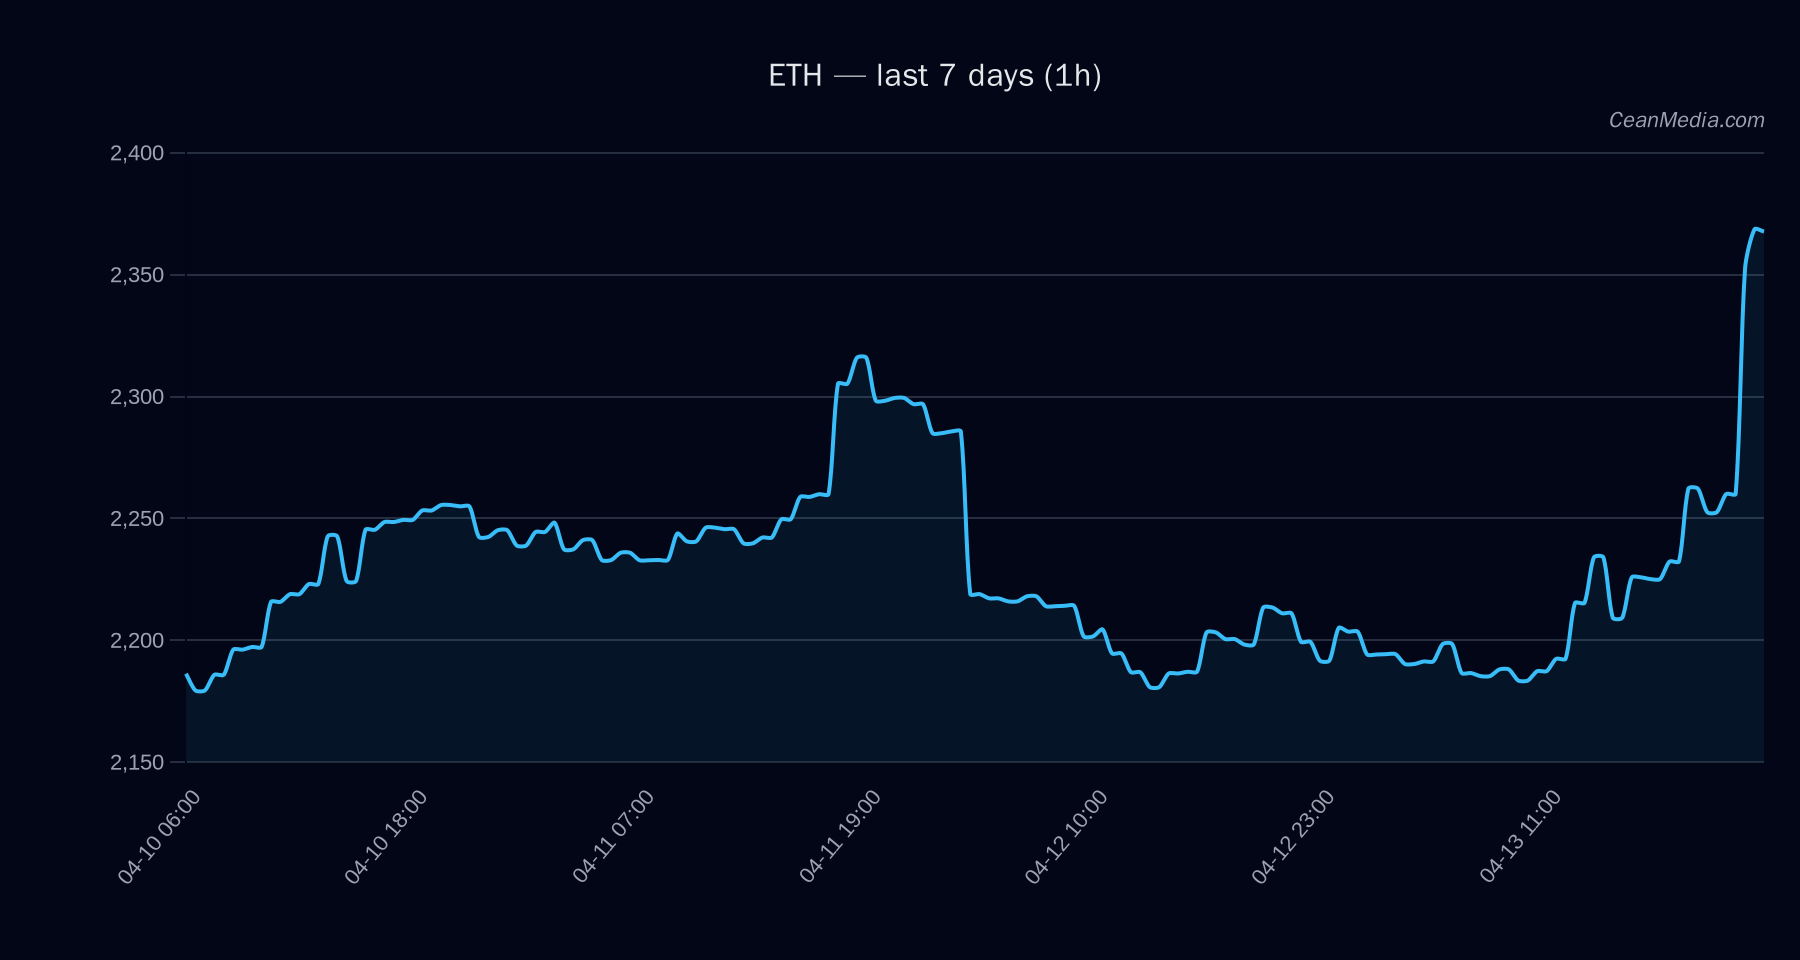
On 2026-04-14, ETH trades near 2,366.73 with a short-term bullish tilt according to the latest TA. Market breadth shows breadth >50h at 100%, BTC-ETH correlation over 72 hours is high (0.92), and the volatility regime is characterized as very low. ETF flow data provided for BTC and ETH is context for broader market risk sentiment rather than a direct primary signal for ETH pricing.
Technical Analysis: ETH
- Current level: 2,366.73
- Trend bias: Up (short-term forecast 49% probability of upside)
- Key indicators: EMA12 above EMA26, SMA50 above SMA200, RSI at 80 (overbought), volatility (σ24h) 0.95%, very low volume regime
- Support and resistance:
- Major support: 2,090
- Near-term support: 2,320
- Major resistance: 2,240
- Near-term resistance: 2,414
- Price targets based on breakouts:
- Upside trigger: a close above 2,414 could lead to 2,462.35 – 2,510.63
- Downside trigger: a close below 2,320 could lead to 2,273.01 – 2,226.62
- Band context: P20–P80 range 2,138.35 – 2,457.81; P50 at 2,272.45
- Invalidation: Break of the 2,320 support with sustained momentum would negate the current bullish bias beyond the near term.
- Top model drivers (high impact): LS TOP Z-SCORE, LS GLOBAL Z-SCORE, SPREAD Z-SCORE, LS GLOBAL DELTA 24H, DISTANCE FROM MA
- Overall reading: Bullish tilt with overbought RSI; risk of a pullback if momentum wanes or if price fails to sustain above 2,414.
Drivers
- Top factors: 24h return (0.08), EMA slope (0.0068), funding z-score (1.67), basis z-score (1.02)
- Order-book imbalance (EMA5) and BTC-related factors contribute to near-term directional signals
- BTC 24h return (~0.046) and BTC/ETH vol regime influence: vol regime currently very low
- Other composite signals: trend strength (~1.63), distance from MA (~0.059), and spread metrics
ETF Flows (BTC/ETH)
ETF flow data is provided for BTC and ETH as context to gauge broad market risk appetite. BTC ETFs show mixed signals over 1D, 5D, and 10D horizons, while ETH ETFs show a modest positive 5D flow. It is important to note that ETF data is not a primary signal for ETH price action but offers context for macro risk-on/off dynamics.
- BTC ETF: 1D negative (-$85.5M), 5D positive (+$493.1M), 10D positive (+$368.8M)
- ETH ETF: 1D negative (-$1.3M), 5D positive (+$109.3M), 10D positive (+$34.7M)
What to Watch Next
- Watch for a close above 2,414 to validate the upside extension toward 2,462–2,510.
- Monitor if price holds above 2,320 on a pullback to confirm near-term bullish bias.
- Observe RSI dynamics near 80 for potential short-term pullback risk or consolidation.
- Keep an eye on ETF flow momentum in BTC while considering ETH-specific factors; ETF signals are contextual and not a primary ETH signal.
Hashtags: #ETH #Ethereum #CryptoAnalysis #BTCETF #ETHETF #MarketOutlook #TechnicalAnalysis #TradingView #CryptoNews #BlockchainMarkets #AltMarkets