Market Snapshot
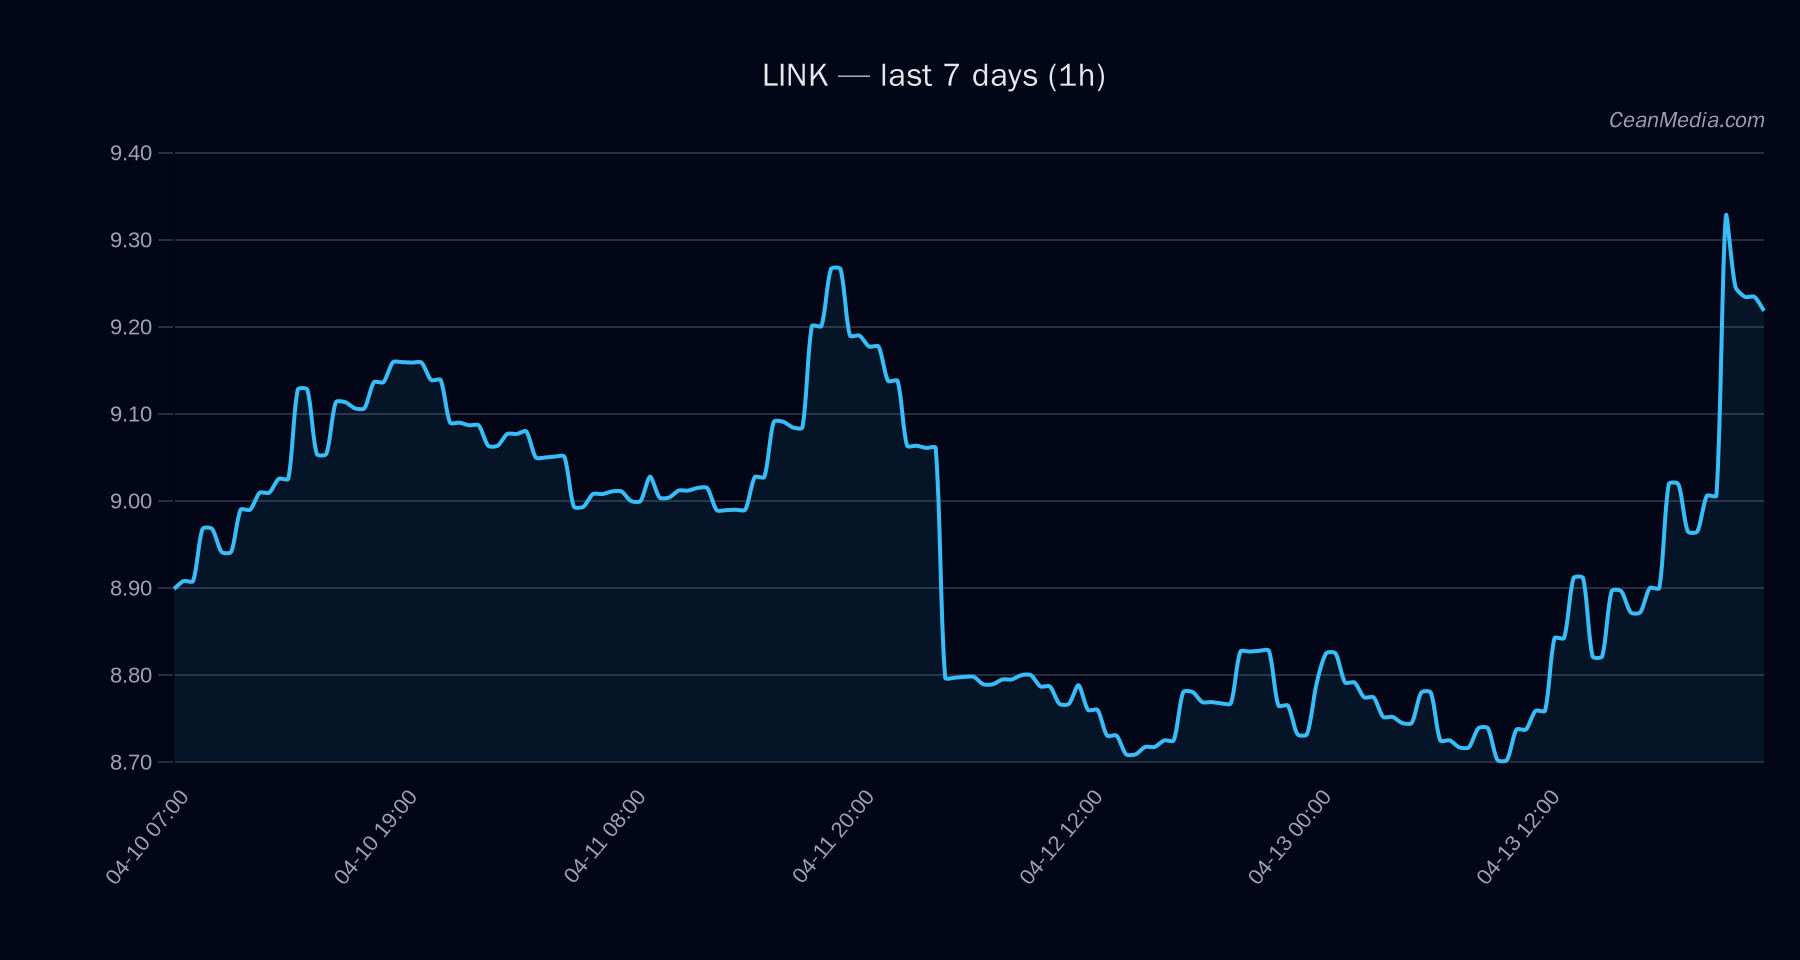
On 2026-04-14, Chainlink (LINK) trades near the 9.02–9.40 range with a current price around 9.21. Near-term bias remains marginally bullish (probability ~51% for an up move within 24 hours), while the broader distribution indicates a notable downside risk relative to targeted upside. Market context shows very low volatility, breadth supportive readings, and a favorable BTC relationship via cross-asset momentum signals.
Technical Analysis: LINK
Approximately 9.21 EMA12>EMA26; SMA50 - Major Support: 8.54
- Near Support: 9.02
- Major Resistance: 9.08
- Near Resistance: 9.40
- Break above 9.40 → potential targets 9.5821 to 9.77
- Break below 9.02 → potential retreat to 8.8453 to 8.6648
Sideways-to-bullish bias with RSI in neutral-to-high territory. Price is hovering inside a defined range with limited volatility.
Drivers
- Top drivers indicate a mixed momentum: 24h returns small but positive; EMA slope suggests mild upside bias; funding and basis metrics show mixed signals; order-book imbalances are minimal; BTC-related indicators show elevated volatility regimes but constructive momentum.
Return 24h (~0.05), EMA Slope (~0.003), BTC Return 24h (~0.049), Funding Z-Score (~0.73)
ETF Flows (BTC/ETH)
Contextual ETF flow data is provided for BTC and ETH only. BTC ETFs show a 1D outflow of approximately $314.7M, with 5D inflow of about $263.9M and 10D inflow of $139.6M. ETH ETFs show a small 1D inflow of ~$2.6M, with 5D inflow of ~$113.2M and 10D inflow of $38.6M. This data is context for market risk sentiment and is not a primary signal for LINK. The flows suggest a mixed risk-on signal with recent BTC weakness offset by longer-dated inflows in BTC/ETH, while LINK-specific momentum remains the primary driver for its price action.
What to Watch Next
- Monitor for a breakout above 9.40 to confirm potential acceleration toward 9.58–9.77.
- Watch for a break below 9.02 which could shift the near-term risk toward 8.66–8.85.
- Observe changes in vol regime and breadth signals which could precede larger directional moves.
- Track BTC/ETH ETF flow shifts as supplementary risk indicators, while keeping LINK analysis anchored to its own TA levels.
Hashtags: #LINK #CryptoMarkets #TradingStrategy #TechnicalAnalysis #ETFFlows #BTC #ETH #MarketContext #PriceAction #RiskManagement #Volatility #MarketSignal