Market Snapshot
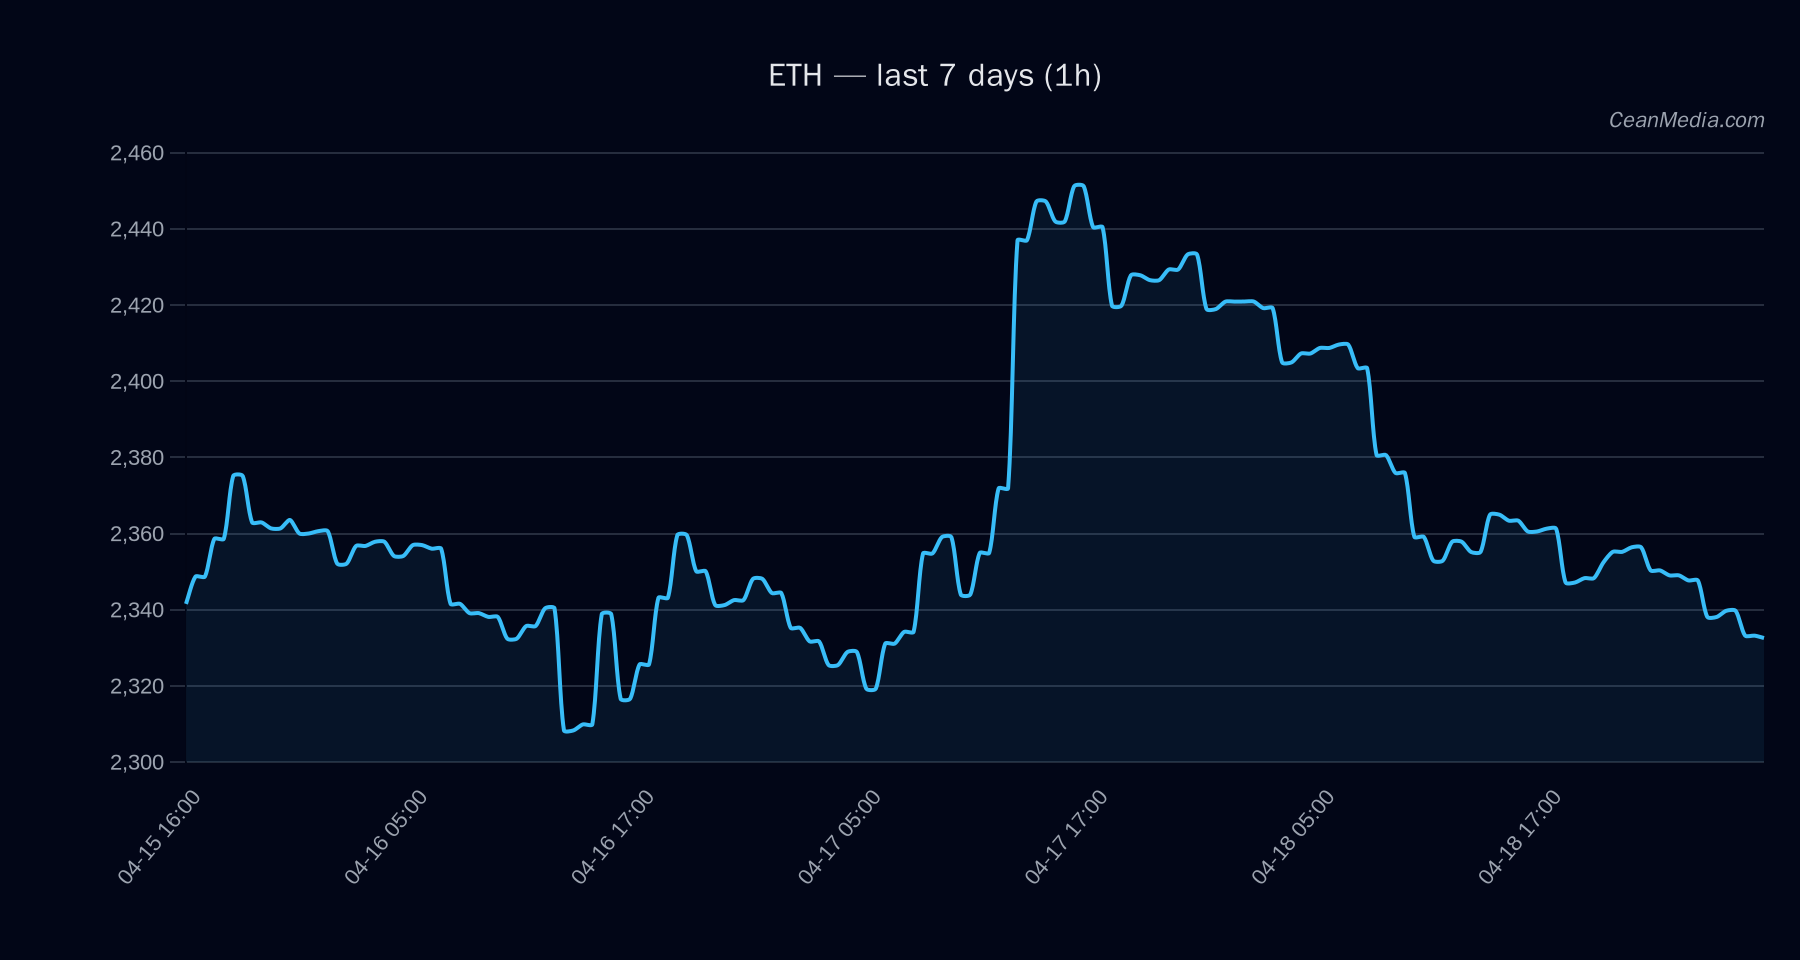
ETH trades around the mid-2,300s, with the current price near 2,329.85. The instrument sits between a near-term support at 2,284 and a near-term resistance at 2,376. The narrative shows a skew toward the upside if price breaks above the 2,376 resistance, potentially targeting 2,423.98 to 2,471.50. Conversely, a break below 2,284 could expose 2,237.59 to 2,191.92. The immediate bias is described as “up” with a 58% probability, while the broader TA indicates sideways dynamics on some indicators (RSI 29, very low volatility regime). ETF data provided here is BTC/ETH context and not a primary ETH signal.
Technical Analysis: ETH
EMA12 Break above 2,376 triggers upside continuation toward 2,423.98–2,471.50; break below 2,284 triggers downside toward 2,237.59–2,191.92. P50 at 2,413.61; P20–P80 range 2,319.44–2,542.93.
Drivers
LS GLOBAL DELTA 24H (-2.05, value 3.47), LS TOP DELTA 24H (1.49, 3.21), LS GLOBAL Z-SCORE (0.97, 3.47). ETC signals show mixed momentum with a tilt toward recent delta dynamics. BTC RV 24H negative (-0.72, value -1.27) while overall trend strength indicators suggest modest bullish pressure in the short term but supported by low realized volatility. OI delta and EMA-based measures show mixed effects; vol regime remains very low. ρ(BTC,72h) = 0.92 indicates strongBTC-ETH correlation over 72 hours; BTC ETF data show inflows, which may influence market sentiment indirectly.
ETF Flows (BTC/ETH)
Context: ETF flow data is shown for BTC and ETH to provide a market-wide backdrop. BTC ETF inflows have been robust across 1D, 5D, and 10D horizons (e.g., +$634.8M / 5D +$630.2M / 10D +$1.22B). ETH ETF data also shows positive 1D, 5D, and 10D inflows (+$132.7M / +$222.8M / +$263.1M respectively).
Important note: ETF data is BTC/ETH context and not a primary signal for ETH price action. It serves as an interpretive backdrop to gauge broader institutional demand and risk-on/off sentiment that may spill over into ETH performance.
What to Watch Next
- Monitor for a clear break above 2,376 to confirm upside momentum toward 2,423.98–2,471.50.
- Watch for a break below 2,284 to validate downside targets of 2,237.59–2,191.92.
- Keep an eye on BTC-ETH correlation signals and overall risk appetite, given ETF inflows and the BTC/ETH-influenced sentiment backdrop.
- RSI remains in oversold territory; any relief rally may encounter resistance near 2,362–2,376 before potential extension.
Hashtags: #ETH #Bitcoin #ETFinflows #TechnicalAnalysis #PriceAction #SupportResistance #MarketSentiment #Tier1 #CryptoNews #BitcoinETF #AltMarket #CryptoTrading
Hashtags: #ETH #Bitcoin #ETFFlows #TechnicalAnalysis #PriceAction #MarketSentiment #CryptoTrading #CryptoMarkets #BTCETH correlation #RiskOn #Liquidity
WordPress Tags: eth, technical-analysis, market-outlook, etf-flows, btc-eth, price-action