Market Snapshot
Solana (SOL) trades around the mid-to-upper-80s range with near-term support seen at 83.6 and resistance around 87.0–87.3. The market environment is characterized by a very low volatility regime and a cautious outlook, with a 53% probability of an upside move in the 24-hour horizon according to the provided model output. Breadth indicators show limited participation from broader market breadth metrics.
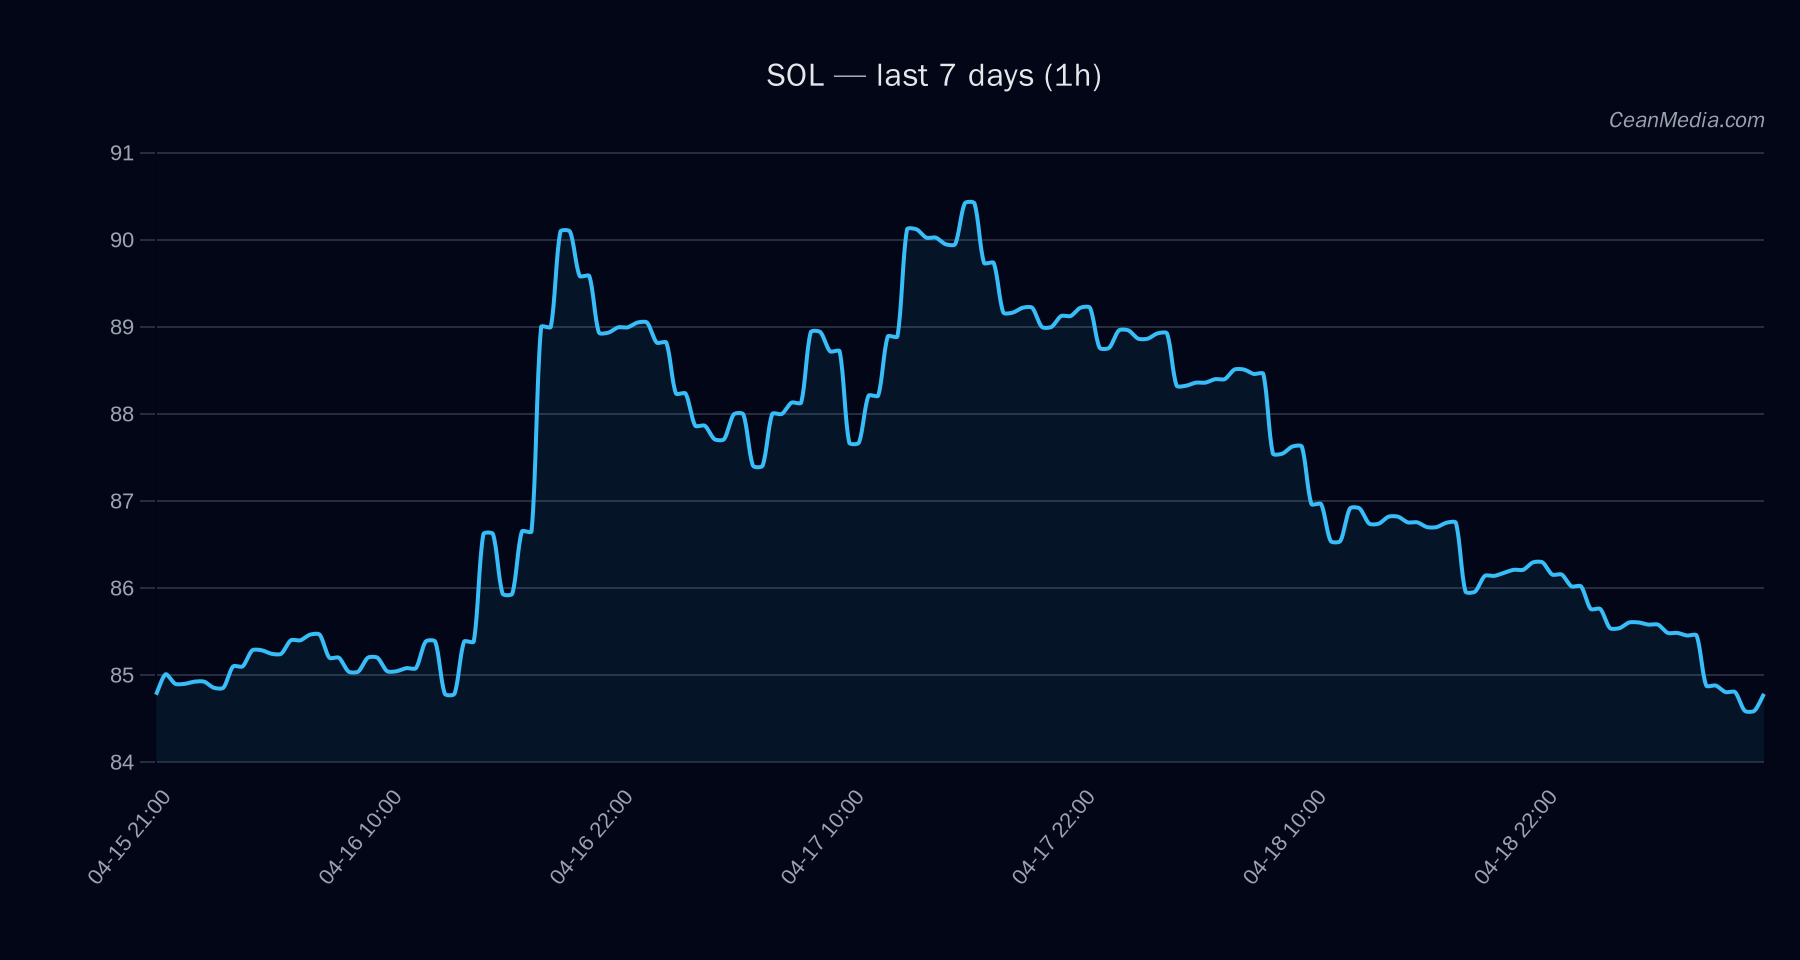
Technical Analysis: SOL
- Current price: 85.29
- Trend bias: Up (short-term forecast 53% probability)
- Momentum/RSI: RSI 37, indicating neutral to oversold conditions on a short horizon
- Moving averages: EMA12 < EMA26, SMA50 > SMA200 (mixed signals), suggesting a non-strong directional tilt
- Volatility: σ24h 0.33%, Very low volatility regime
- Price bands: P20–P80 = 81.47 – 94.56; P50 (median) = 87.76
- Key levels: Support 1 = 83.6 (near), Support 2 = 81.2 (major); Resistance 1 = 87.0 (near), Resistance 2 = 87.3 (major)
- Upside/Downside triggers: Upside if 1h close > 87 → potential range 88.74 – 90.48; Downside if 1h close < 83.6 → potential range 81.91 – 80.24
- Overall stance: Forecast indicates upside with a sideways-leaning TA backdrop due to EMA/SMA configuration and low volume.
Drivers
- Top drivers (relative contribution): SPREAD BP positive (1.77; value 8.74); BTC RV 24H negative (-0.71; value -1.32); LS GLOBAL DELTA 24H positive (0.58; value 1.78); LS TOP Z-SCORE negative (-0.46; value -0.57); RV 24H positive (0.41; value -1.27); BTC VOL REGIME negative (−1.52); SPREAD Z-SCORE negative (−1.59); LS TOP DELTA 24H negative (−0.29; value 1.29)
- Model drivers snapshot: The top drivers indicate mixed momentum with a tilt toward spread and BTC-related metrics, while broader volatility signals are subdued in the current regime.
- Contextual reads: BTC dominance around 57.5% (up modestly over 7 days) and Fear index at 27 suggest a cautious risk appetite environment; overall volume regime remains very low.
ETF Flows (BTC/ETH)
Contextual ETF flow data is provided for BTC and ETH only. BTC ETF flows show positive daily, 5-day, and 10-day totals (1D: +$634.8M; 5D: +$630.2M; 10D: +$1.22B) and ETH ETF also positive (1D: +$132.7M; 5D: +$222.8M; 10D: +$263.1M). These figures reflect capital allocation toward BTC/ETH ETFs and should be interpreted as market breadth context rather than primary SOL signals. SOL-specific signals remain driven by SOL-native technicals and market microstructure rather than ETF flows, but broader BTC/ETH flow strength can indicate risk-on environments or liquidity shifts influencing all crypto assets.
What to Watch Next
- Monitor for a close above 87.0–87.3 to validate a potential move toward 88.7–90.5 in the near term.
- Watch for a break below 83.6 to confirm a test of 81.9–80.2, signaling a risk-off tilt.
- Keep an eye on BTC/ETH ETF flow momentum as a contextual gauge of overall risk appetite, while not treating it as a primary SOL signal.
- Observe changes in RSI and volume regime; a shift from very low volatility to an uptick could precede a more defined SOL directional move.
Hashtags: #SOL #Solana #CryptoAnalysis #TechnicalAnalysis #ETFFlows #BTC #ETH #MarketSentiment #PriceLevels #Volatility