Market Snapshot
Bitcoin (BTC) remains range-bound between major support at 73,725 and resistance at 76,750. The near-term bias is seen as “up” with a 54% probability for the next move higher, contingent on a break above 76,750. EUR/USD, equities, and macro momentum are not the focus here; BTC technicals and ETF flow context provide the framework for short-term directional assessment.
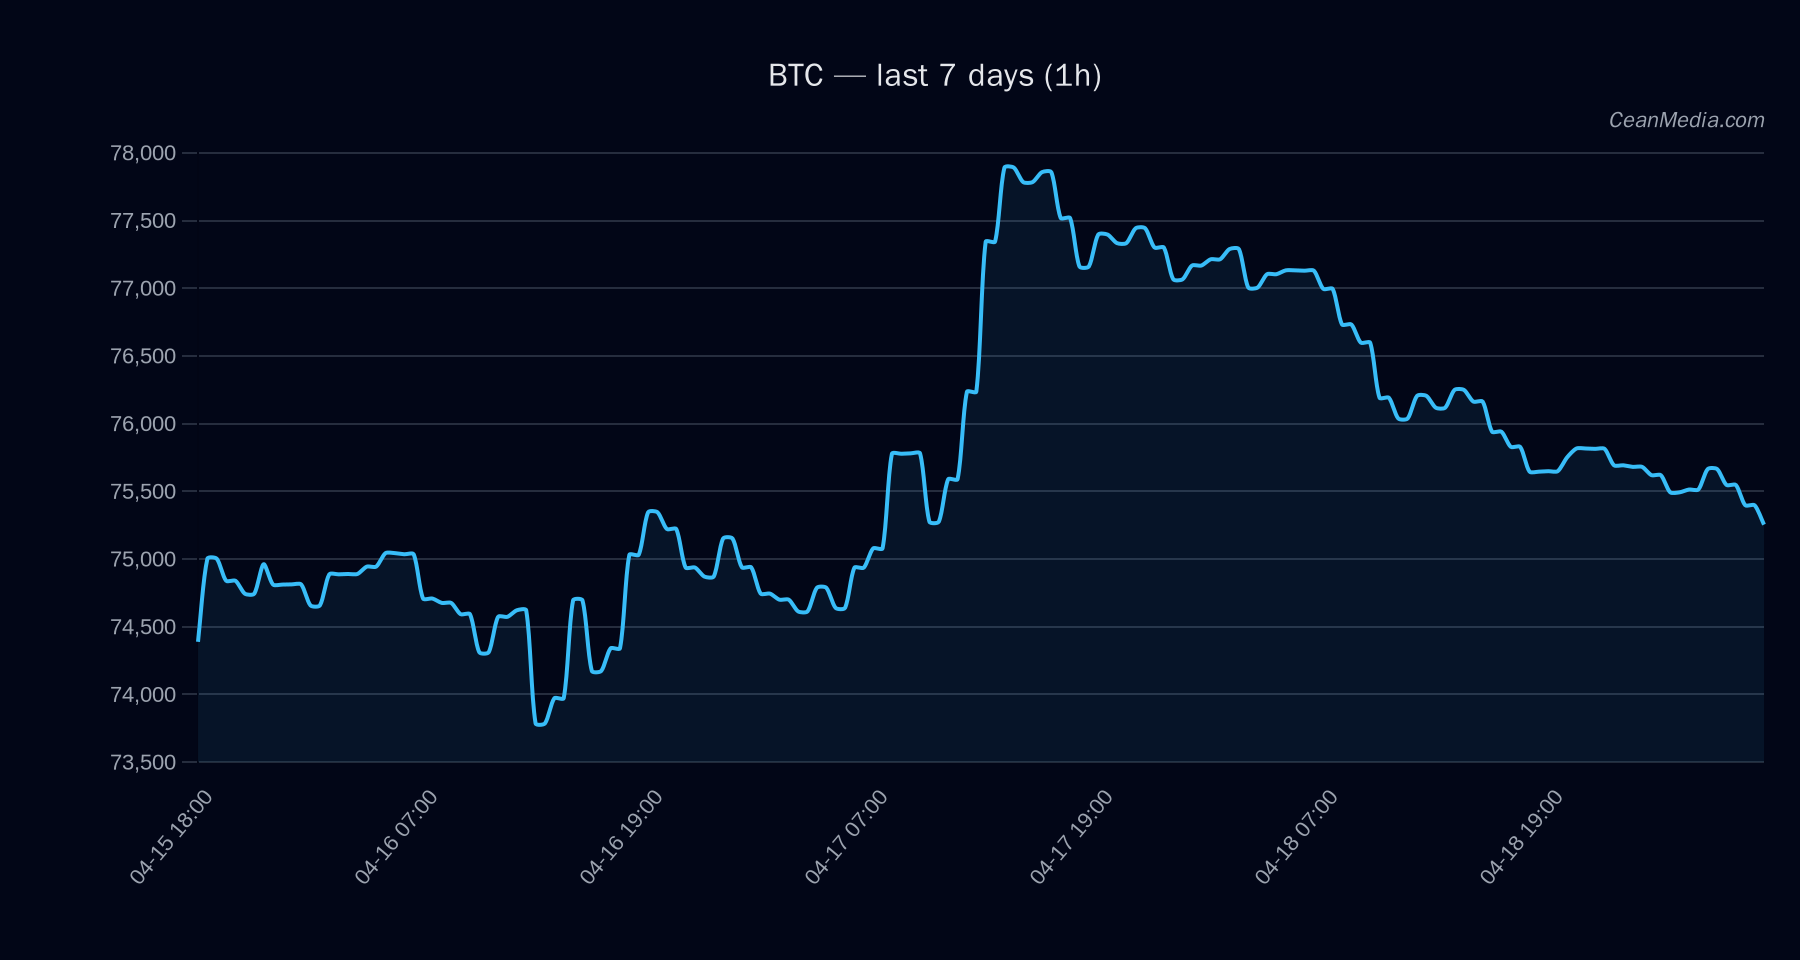
Technical Analysis: BTC
- Current price: 75,236.01
- Bias / forecast: Up (54% probability) with sideways TA characteristics from the technical indicators
- Support / Resistance: Major support at 71,625; Near-term support at 73,725. Major resistance at 75,625; Near-term resistance at 76,750.
- Key trigger levels: Break above 76,750 targets 78,275.54 → 79,810.36. Break below 73,725 targets 72,256.66 → 70,782.04.
- Neutral/sideways indicators: EMA12 < EMA26; SMA50 > SMA200; RSI at 31 (oversold territory), volatility (σ 24h) 0.18%; volume regime: Very Low.
- P50 / Band: P50 at 76,177.38; Band (P20–P80) 69,793.26 – 81,511.69.
- Notes on momentum: Top drivers point to a mixed momentum regime with some bearish impulse (negative contributions from several Z-scores) balanced by positive contributions from others. Overall trend strength metric indicates modest up-day potential if price breaks current resistance.
Top Drivers (BTC)
- RETURN 24H: -0.02
- EMA SLOPE: -0.0008
- FUNDING Z-SCORE: -0.92
- BASIS Z-SCORE: -1.88
- OBI EMA5: -0.04
- BTC RETURN 24H: -0.02
- BTC VOL REGIME: -1 (Very Low Volatility Context)
Drivers
- LS GLOBAL DELTA 24H: -1.68
- LS TOP DELTA 24H: 1.46
- LS TOP Z-SCORE: 1.2
- LS GLOBAL Z-SCORE: -1.11
- SPREAD Z-SCORE: 1.02
- OI DELTA 24H: 0.63
- VOL REGIME: 0
- Longer-term trend strength: modestly positive with distance from MA around -0.0062
ETF Flows (BTC/ETH)
Context: ETF flow data is provided for BTC and ETH. For BTC, the daily and multi-day inflows are positive, suggesting a risk-on tilt in custody/derivative demand. ETH shows smaller incremental flows by comparison. This information should be treated as context rather than a primary signal for BTC price action.
- BTC ETF: 1D +$634.8M | 5D +$630.2M | 10D +$1.22B
- ETH ETF: 1D +$132.7M | 5D +$222.8M | 10D +$263.1M
What to Watch Next
- Break above 76,750: Target 78,275.54 to 79,810.36 if the move sustains.
- Break below 73,725: Watch 72,256.66 and 70,782.04 as potential downside targets.
- Monitor ETF flow momentum: continued BTC inflows could reinforce near-term upside bias.
- RSI remains in oversold-ish territory (29–31 area); look for RSI reversion with price action above 76,750 for confirmation.
Hashtags: #BTC #Bitcoin #CryptoMarkets #ETFFlows #TechnicalAnalysis #MarketSnapshot #TradingStrategy #RiskOn #PriceAction