Market Snapshot
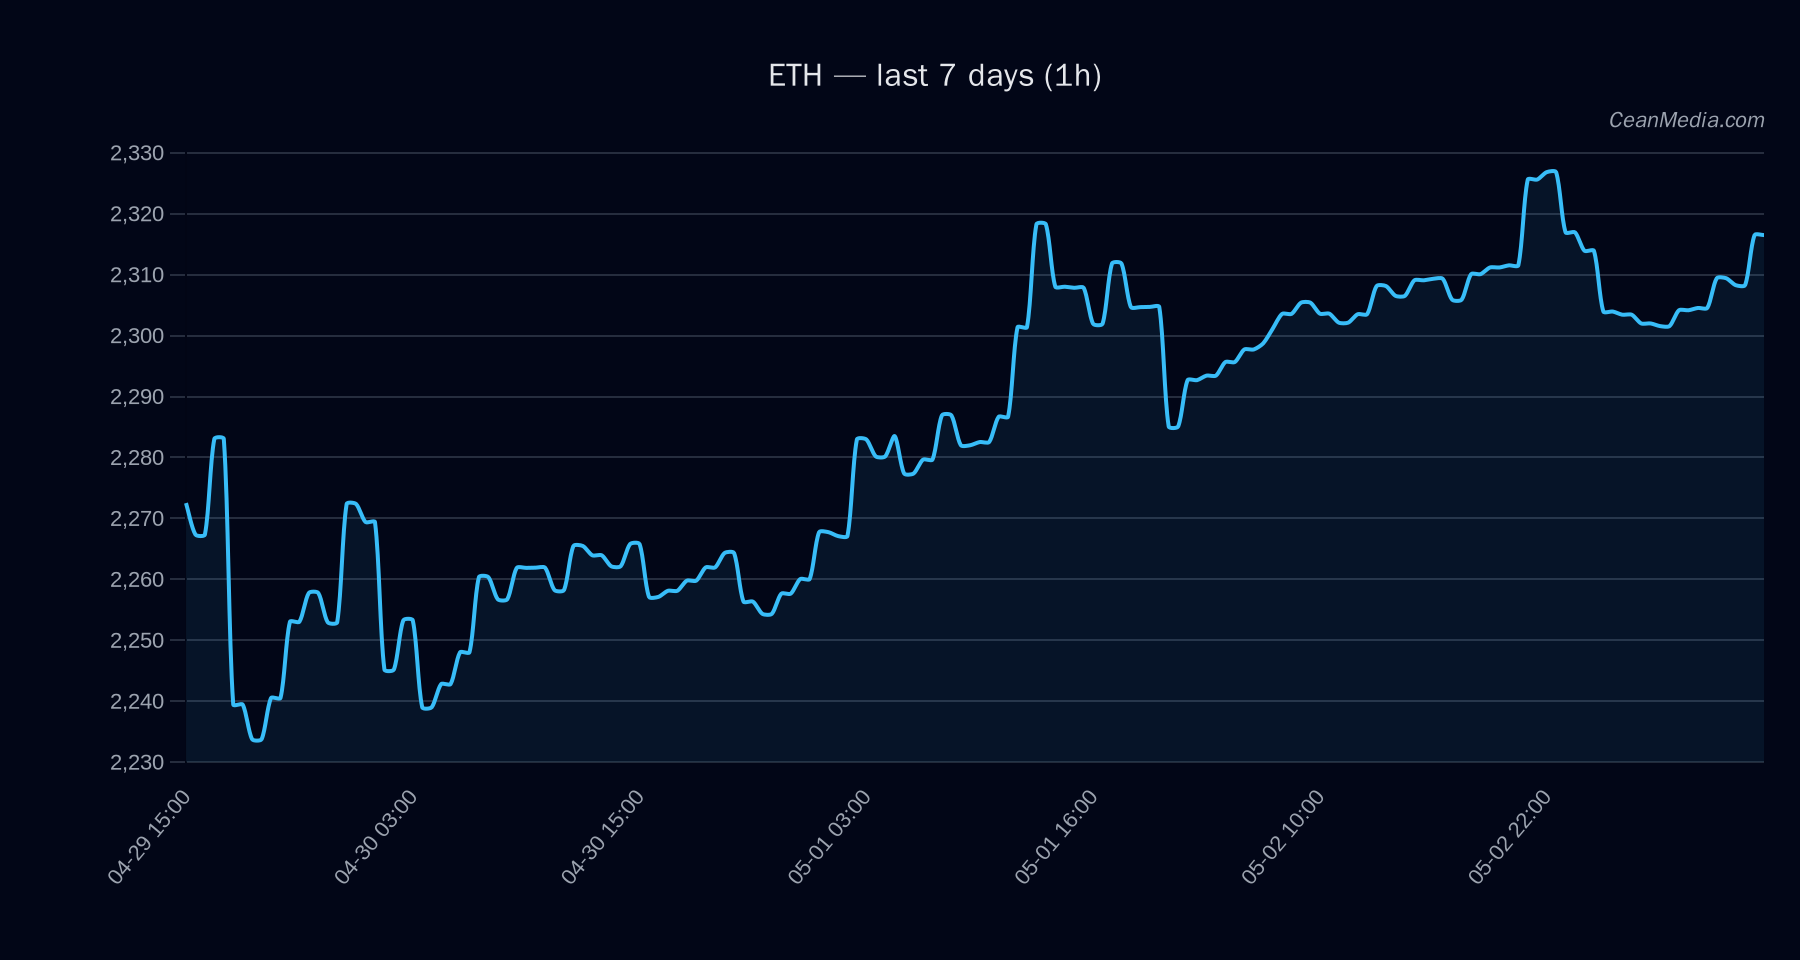
As of 2026-05-03, ETH trades in a narrow, mixed-to-neutral setup with a close around 2,312.19. The broader technicals show a sideways trend with mixed conviction, while ETF flow data for BTC/ETH provides context on market breadth but should not be treated as a primary signal for ETH alone.
Technical Analysis: ETH
- Mixed/neutral with low certainty (5/100). TA trend described as sideways. RSI at 57 indicates modest near-term momentum without overbought/oversold pressure.
- Close at 2,312.19. Forecast suggests a downside bias (71% probability) over the next 24 hours.
-
- Support: around 2,266 (near) / 2,276 (major)
- Resistance: around 2,358 (near) / 2,386 (major)
-
- Upward trigger: 1h close > 2,358 targets 2,405.60 – 2,452.77
- Downward trigger: 1h close < 2,266 targets 2,220.63 – 2,175.31
- Composite score +0.1 with data caveats (13% data missing; snapshot age 0.0h). Evidence is not fully aligned; confirm triggers before treating direction as high-conviction.
- Very low volatility regime (σ24h ≈ 0.20%), ATR ≈ 3.84, breadth > 50% with 83% above SMA50. BTC/ETH correlation strong (ρ ≈ 0.92 over 72h).
- EMA slope, order-book imbalances (EMA5), and funding/basis Z-scores contribute to the current posture.
Drivers
FNG VALUE, BTC DOMINANCE, RV 24H, BTC RV 24H, CROSS ASSET RISK Z-SCORE, OI DELTA 24H. - Overall momentum skewed toward modest downside probability with a neutral risk posture; fear sentiment index around 38 suggests cautious participation.
- Long positioning is moderately crowded (1.26x) with short-term buy pressure signals from taker flow; short squeeze pressure noted (+92.9%).
- Cross-market risk assets supportive; stablecoin liquidity contracting slightly over 7D; BTC dominance around 58.4%.
ETF Flows (BTC/ETH)
ETF flow data covers BTC and ETH only and is provided for contextual market breadth, not as a primary ETH signal. Recent data show:
- 1D +$629.8M; 5D +$198.4M; 10D +$585.2M
- 1D +$101.2M; 5D -$20.8M; 10D +$81.6M
Interpretation: The BTC ETF activity indicates a risk-on environment with broad buying interest reflected in a strong short-term inflow. ETH ETF flows are positive on the 1D horizon but show a modest pullback over 5D, suggesting a mixed macro signal. Given that ETF data is BTC/ETH oriented and not ETH-specific, these figures should be considered as context rather than a primary driver for ETH price action.
What to Watch Next
- Watch for a daily/1h close above 2,358 to validate an upside breakout toward 2,405–2,452 if momentum improves.
- Monitor a breakdown below 2,266 to validate a move toward 2,220–2,175, potentially accelerating if selling pressure increases.
- Keep an eye on BTC dominance and BTC price action, given the high correlation and its influence on ETH sentiment.
- Observe ETF flow shifts, especially BTC ETF inflows, for corroborating or contradicting signals in a broader risk-on/risk-off cycle.
Hashtags: #ETH #Ethereum #CryptoTrading #TechnicalAnalysis #ETFFlows #BTC #BTCETH #MarketSnapshot #RiskOn #MarketAnalysis #PriceAction #Liquidity