Market Snapshot
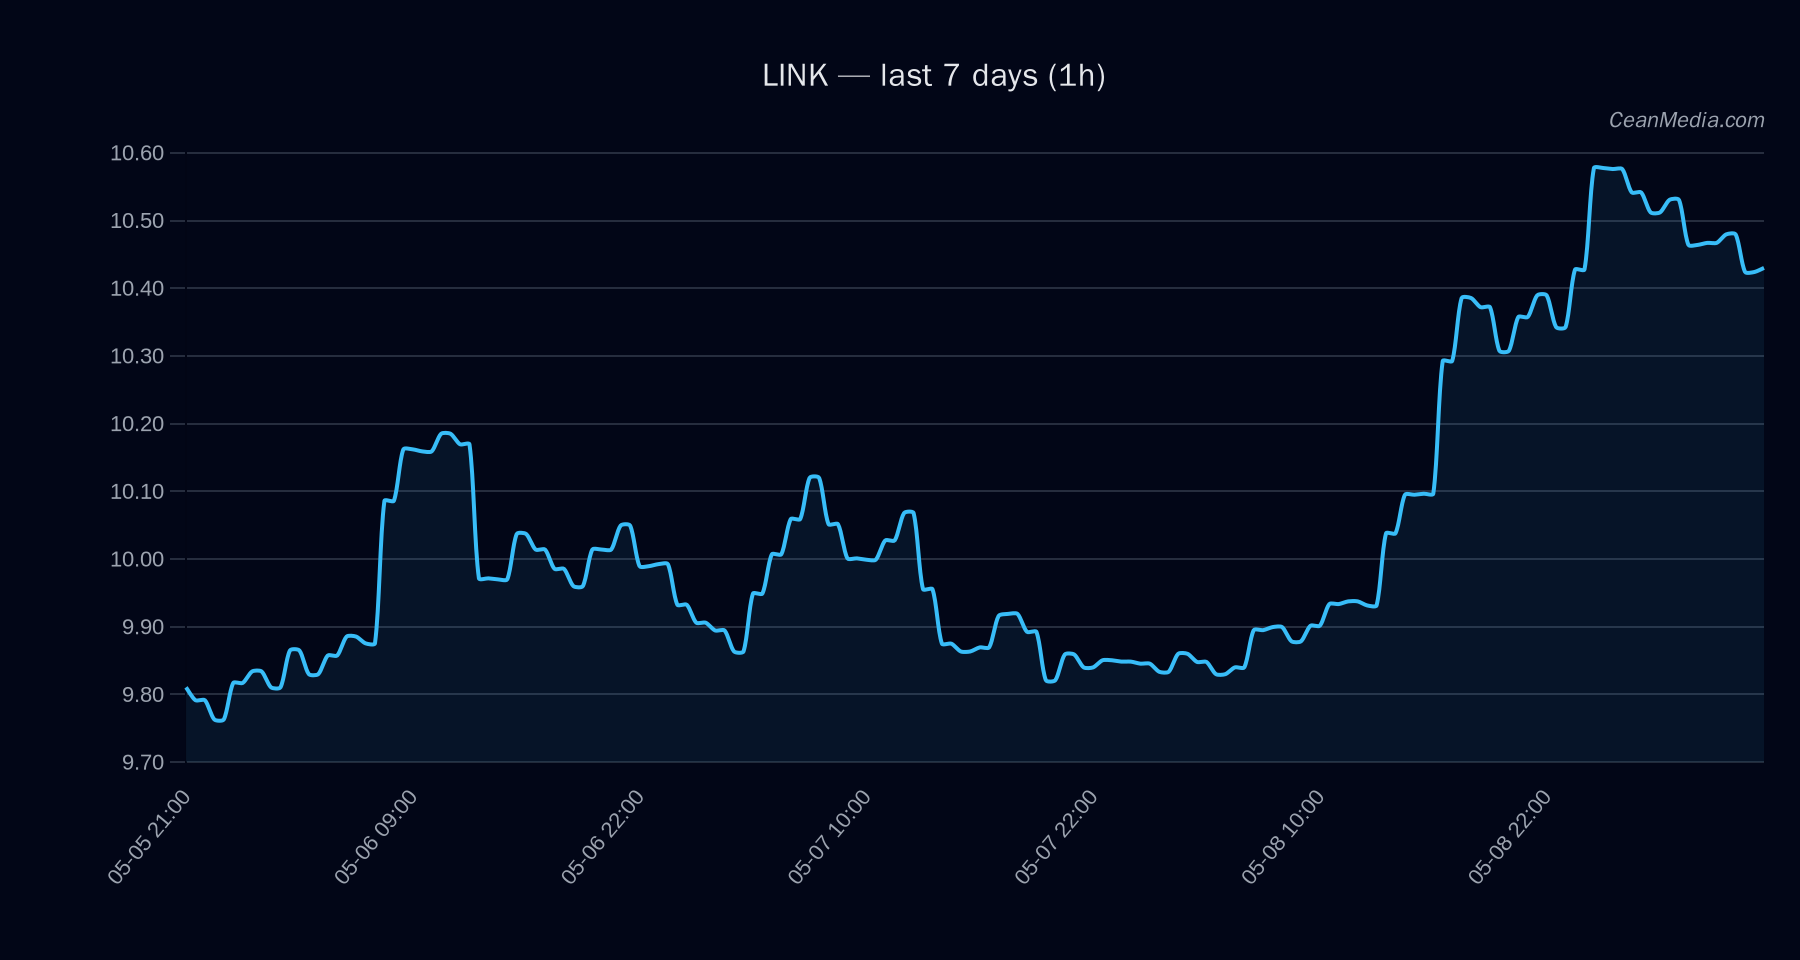
Asset: LINK | Price: 10.46 (close) | Date: 2026-05-09
Market context: Volatility is very low with a breadth reading at 100% above the 50-day moving average. BTC correlation over 72h stands at 0.70, and overall macro sentiment shows fear levels around 38 on the fear/greed index. ETF flows are positive for BTC and ETH over 1D, 5D, and 10D horizons, indicating a risk-on tilt in broad markets that may influence risk assets including LINK as sentiment-friendly liquidity conditions persist.
Technical Analysis: LINK
- mixed with bullish pressure; certainty low (11/100).
- +3.3 with 3 conflicts.
- Close at 10.46. Forecast range for the next session is 9.40 to 11.28, with P50 around 10.36.
- TA trend is bullish (EMA12>EMA26, SMA50>SMA200, RSI 63). Historical volatility (σ24h) at 0.63% and a very low vol regime support a narrow trading range.
- Support near 10.30 (major 9.46); Resistance near 10.70 (major 9.98).
- Upward break > 10.70 targets 10.88–11.10; Downward break < 10.30 targets 10.05–9.84.
- A sustained move outside the defined range with confirmation would be needed to alter the directional bias from the current mixed/low-conviction stance.
Drivers
- include: EMA slope (-0.0001), funding z-score (0.63), basis z-score (-0.50), and 24h return (0.053) among others.
- Vol regime is very low; volatility of vol is low, indicating a subdued immediate price dynamic.
- Cross-market risk assets supportive; stablecoin liquidity expanding (0.32% over 7D); market sentiment tilts toward fear (~30).
- Taker buy pressure exists with long crowded positioning (~1.42x).
ETF Flows (BTC/ETH)
Context: ETF flow data provided here pertains to BTC and ETH and is included for market context, not as a primary signal for LINK. The interpretation should be that fund flows into BTC and ETH reflect a risk-on environment that can influence correlated or risk-sensitive assets including LINK, but is not a substitute for LINK-specific signals.
- +$629.8M (1D), +$198.4M (5D), +$585.2M (10D)
- +$101.2M (1D), -$20.8M (5D), +$81.6M (10D)
What to Watch Next
- Watch for a close above 10.70 on a 1-hour or 4-hour candle to validate potential upside acceleration toward 10.88–11.10.
- Monitor a break below 10.30 with confirmation to validate a pullback toward 10.05–9.84.
- Observe changes in ETF flow context for BTC/ETH as a potential broad-market risk-on/off signal which can influence LINK volatility and liquidity effects.
- Keep an eye on macro risk sentiment indicators and BTC dominance, which can shift correlation dynamics and affect LINK’s short- to medium-term path.
Hashtags: #LINK #CryptoMarkets #TechnicalAnalysis #ETFFlows #BTC #ETH #MarketSnapshot #RiskOn #PriceAction #Liquidity