Market Snapshot
As of 2026-05-14, LINK is trading around the 10.25 level with a bearish bias and a medium certainty. The composite score sits at -4.1 with low data missing (3%) and a very low volatility regime. The market context shows BTC dominance around 58.2%, breadth modestly positive versus the 50-hour moving average, and a fear sentiment reading at 34. These factors collectively support a cautious stance for LINK in the near term.
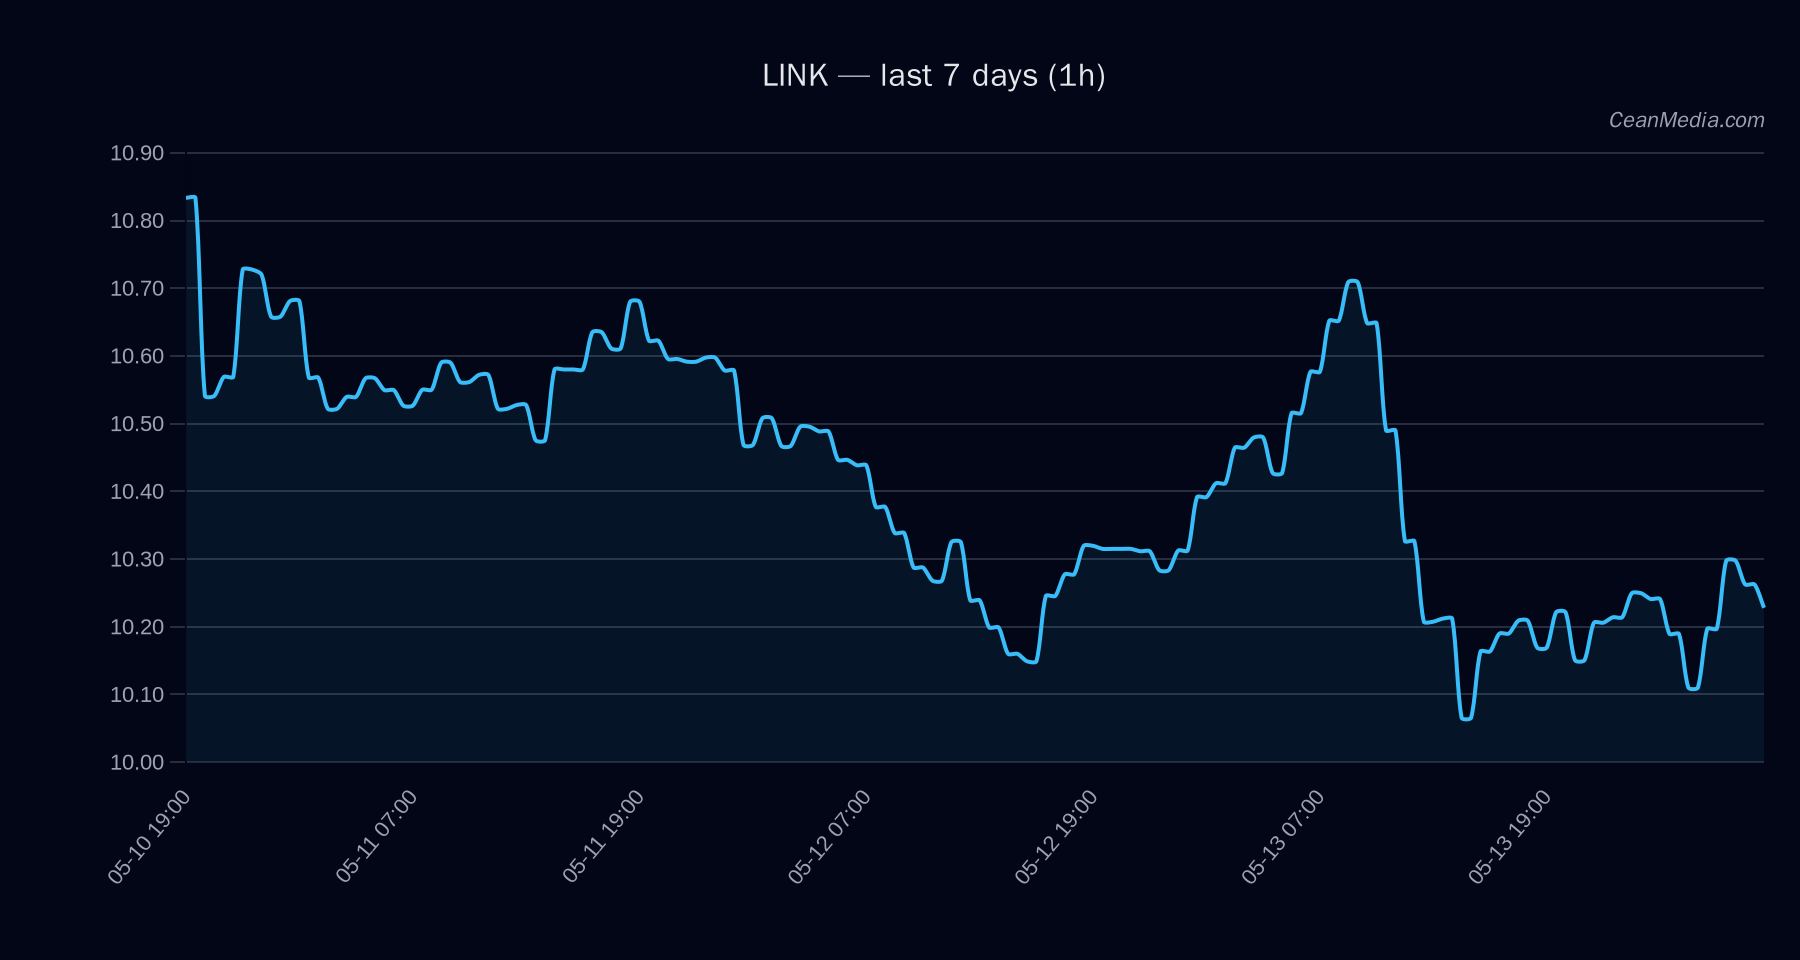
Technical Analysis: LINK
down (66%) with P20-P80 range of 9.6838 – 10.6406; P50 at 10.1078 sideways; RSI 49 EMA12 < EMA26, SMA50 > SMA200, RSI neutral at 49, σ24h = 0.76%, very low vol regime 10.25
20th-80th percentile 9.6838 – 10.6406
- Up: 1h close above 10.5 → potential move to 10.6641 – 10.8732
- Down: 1h close below 10 → potential move to 9.8441 – 9.6432
Drivers
SPREAD BP (-) 7.62, FNG VALUE (+) 27.2, BTC DOMINANCE (+) 2.25, BTC return (-) -0.02, NASDAQ/ SP500 returns modest cross-market risk assets soft; stablecoin liquidity contracting; sentiment leaning to fear (F&G: 34) market depth metrics show balanced taker flow with long crowded positioning (1.42x) very low, with ATR 0.0469 and vol unit 0.082
ETF Flows (BTC/ETH)
The ETF flow data provided covers BTC and ETH only and should be interpreted as contextual market activity rather than a primary signal for LINK. Recent data show BTC ETFs with net positive inflows in the 1D, 5D, and 10D windows (+$629.8M, +$198.4M, +$585.2M respectively) and ETH ETFs also showing inflows in the 1D window (+$101.2M) but mixed results over longer spans. While indicative of risk-on/risk-off sentiment, these flows do not directly drive LINK pricing, but they help frame the broader liquidity backdrop and potential USD liquidity shifts in the ecosystem.
What to Watch Next
- Watch for a close above 10.5 on a 1-hour basis to confirm an upside trigger towards 10.66–10.87.
- Monitor for a break below 10 to see if downside targets of 9.84–9.64 come into play.
- Observe changes in BTC dominance and cross-market risk appetite as potential tailwinds or headwinds for LINK.
- Stay alert to shifts in the volatility regime; an uptick in σ24h or ATR could alter pattern expectations.
Hashtags: #crypto #LINK #marketanalysis #technicalanalysis #ETFs #BTC #ETH #riskon #riskoff #blockchain #trading
Note: ETF data is provided for BTC/ETH context only and should not be used as a primary signal for LINK trading decisions.