Market Snapshot
As of 2026-05-24, BNB sits within a narrow range with immediate support near 646 and resistance near 673. The composite signal indicates mixed/neutral bias with low conviction. The model forecast leans downwards with a 71% probability, while the TA setup shows bullish internals such as EMA12>EMA26, SMA50>SMA200, and RSI at 60, set against very low volatility. A breakout above 673 or breakdown below 646 establishes directional targets accordingly.
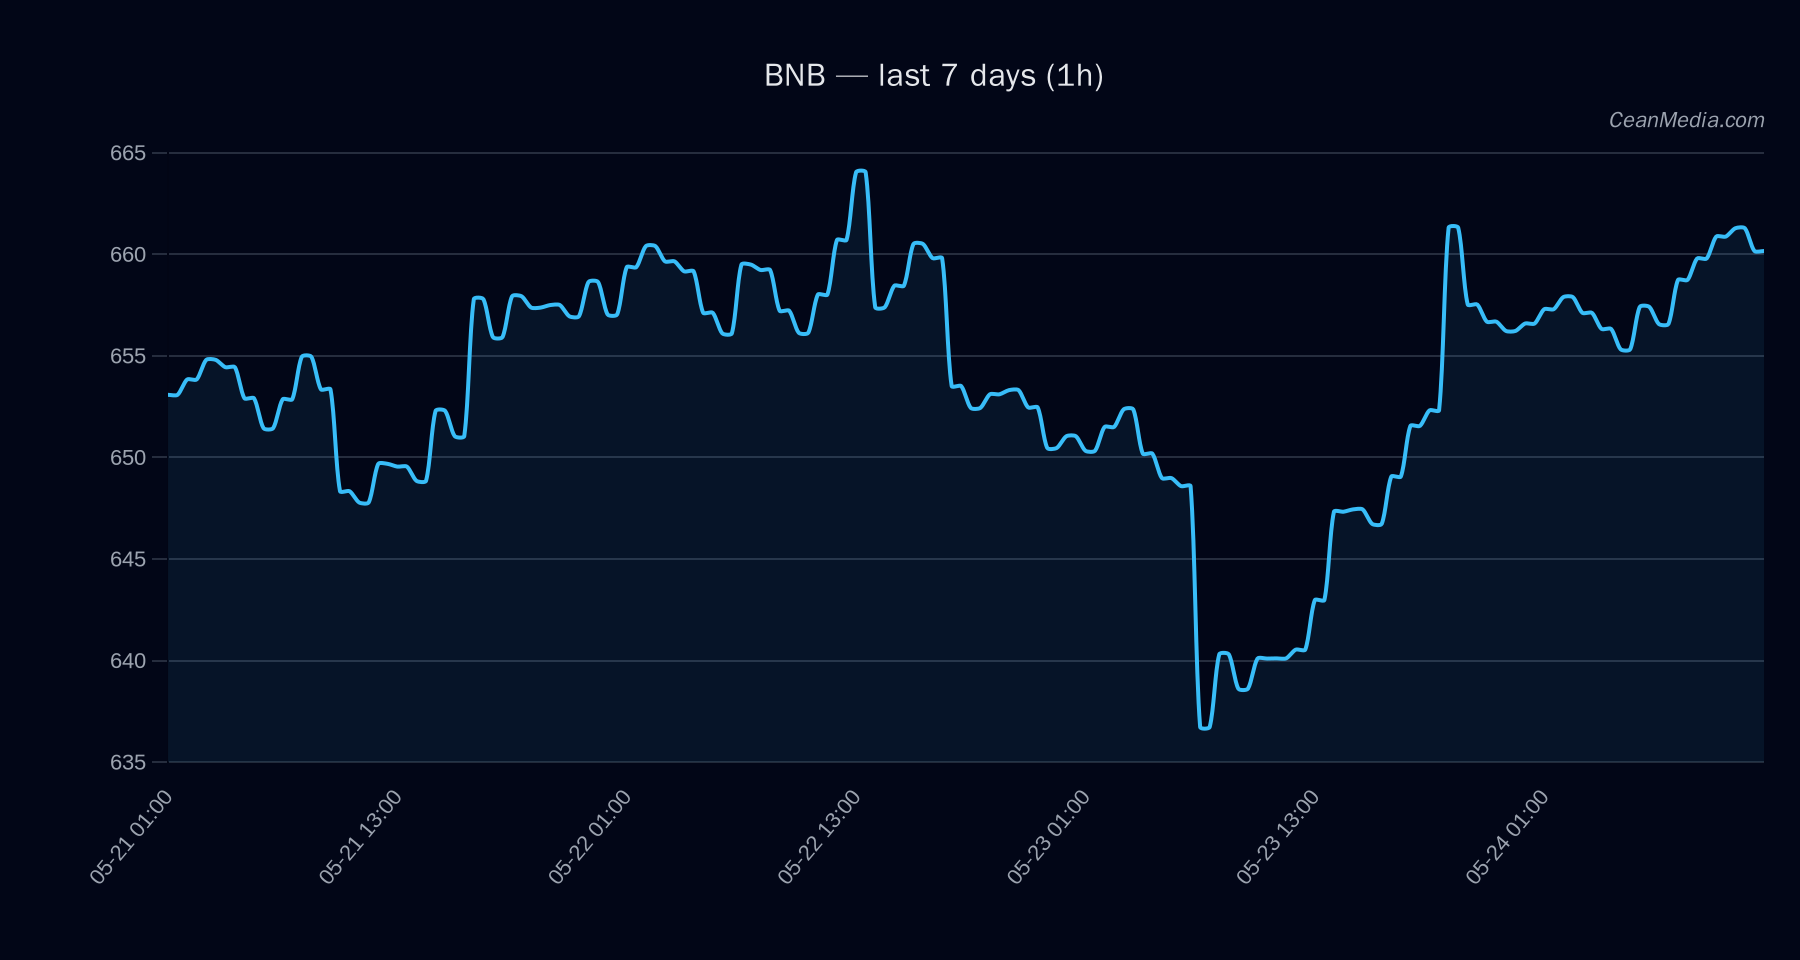
Technical Analysis: BNB
- Mixed/neutral, certainty low (5/100).
- 659.52
- TA trend bullish with RSI 60.
- EMA12>EMA26, SMA50>SMA200, RSI 60, 24h volatility σ24h = 0.37%, volatility regime: very low.
- Down (71%): P50 range 640.90, P20-P80 629.81–679.52.
- Support near 646, major support 640; Resistance near 673, major resistance 674.
- Upward: close > 673 targets 686.16–699.62; Downward: close < 646 targets 633.40–620.48.
- Market context shows breadth > 50 (83%), BTC correlation 0.80 over 72h, overall risk-off factors as context; watch for a confirmed breakout to shift conviction.
Drivers
- Return 24h: 0.03; EMA slope: 0.0005; Funding Z-score: 0.67; Basis Z-score: 1.37; OB-EMA5: -0.12; BTC return 24h: 0.03.
- Vol regime: very low; BTC dominances around 58.16% with slight 24h delta; extreme fear in macro/market sentiment (F&G: 25).
- Positive breadth signal (83% above SMA50) supports cautious risk-on tone in equity/broad markets but not a direct signal for BNB direction.
- The chart signals a mixed setup with bullish internal TA metrics but a forecast leaning down; price action near key levels will be decisive for near-term direction.
ETF Flows (BTC/ETH)
Contextual note: ETF flow data shown here pertains to BTC and ETH only. These figures provide a macro-market context and are not a primary signal for BNB price action. As of the latest read, BTC ETFs show net positive inflows (1D +$629.8M; 5D +$198.4M; 10D +$585.2M) and ETH ETFs also show inflows (1D +$101.2M; 5D -$20.8M; 10D +$81.6M). This suggests a risk-on backdrop in broader crypto markets, which can influence alt-coin cycles indirectly but should not be used in isolation to determine BNB strategy.
What to Watch Next
- Monitor for a close above 673 to validate upside potential toward 686–700 in the short term.
- Watch for a break below 646 to confirm a path toward 633–620 in the near term.
- Observe ETF flow momentum in BTC/ETH as contextual risk-on/off signal but rely on BNB-specific technicals for trading decisions.
- Keep an eye on overall market breadth and BTC dominance shifts, as these can influence alt-season dynamics.
Hashtags: #BNBAnalysis #CryptoMarkets #TechnicalAnalysis #ETFFlows #BTC #ETH #Altcoins #MarketSnapshot #TradingStrategy #RiskOnOff #PriceAction #Liquidity