Market Snapshot
Analysis as of 2026-05-27, SOL sits near key intra-range levels with a bearish bias and a medium certainty score. The composite TA view indicates a -3.4 total score with data completeness at 90%. The price closed at 84.33, within a tight band defined by near-term support and resistance levels. ETF flow context is provided for BTC and ETH to frame macro risk sentiment rather than to drive SOL signals directly.
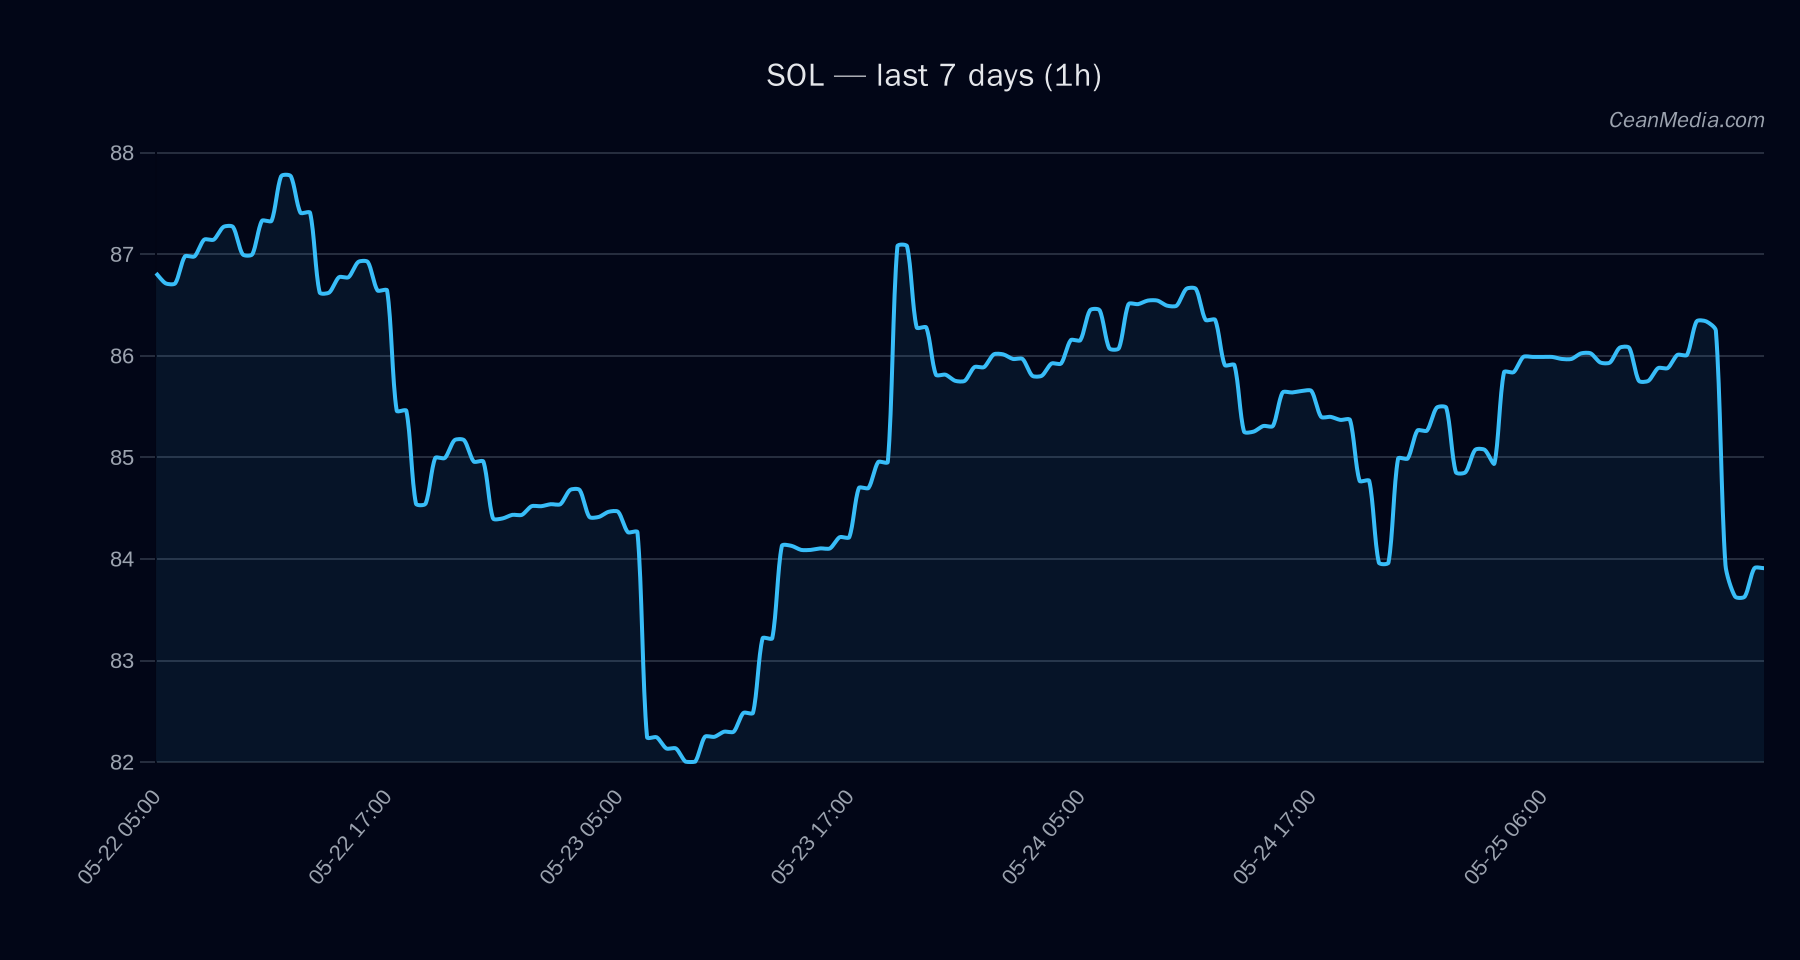
Technical Analysis: SOL
Up 48%, Side 11%, Down 40% (24h horizon) sideways with RSI at 40 EMA12 < EMA26, SMA50 > SMA200, RSI 40, 24h volatility 0.74%
The forecast range places P50 at 85.49 with a 20th-80th percentile band of 80.36 to 91.35. Immediate levels to monitor are:
- Support: near 82.6 (major 84.5)
- Resistance: near 86 (major 89.5)
Triggers:
- Up: 1h close > 86 -> targets 87.74 and 89.46
- Down: 1h close < 82.6 -> targets 80.99 and 79.34
Market context notes very low volatility regime, with BTC dominance around 57.8% and broad risk-off signals reflected in the sentiment metrics (extreme fear, F&G score 25). Breadth on the asset is subdued relative to the SMA50 benchmark (0% above SMA50).
Drivers
Depth USD 10bp log1p, Z-score, RSI-based volatility signals Very low vol regime, EMA slope modestly negative, OBI/imbalance hints at selling pressure in the order flow
ETF Flows (BTC/ETH)
Contextual note: ETF flow data is provided for BTC and ETH only. This information should be interpreted as a macro-risk backdrop rather than a direct SOL signal. BTC ETF flows show positive inflows in 1D, 5D, and 10D windows, while ETH inflows are positive in 1D and 10D but negative over 5D. The data suggest a cautious but liquidity-friendly environment for BTC/ETH, which may influence broader risk sentiment and asset correlations, including SOL, but SOL-specific triggers remain the primary driver for SOL trades.
- BTC ETF Flows: 1D +$629.8M | 5D +$198.4M | 10D +$585.2M
- ETH ETF Flows: 1D +$101.2M | 5D -$20.8M | 10D +$81.6M
What to Watch Next
- Watch for a close above 86 to validate the upside trigger toward the 87.74–89.46 zone.
- Monitor 82.6 as an immediate inflection for potential downside if price breaks through this support.
- Observe changes in BTC dominance and overall risk appetite as BTC/ETH ETF flows evolve in the coming sessions.
- Confirm any deviation from the sideways TA with a sustained RSI move above 50 or a clear EMA cross to re-rate the bias.
Hashtags: #SOL #Solana #CryptoAnalysis #MarketUpdate #TechnicalAnalysis #ETFFlows #BTC #ETH #RiskOn #Liquidity #PriceAction #TradingStrategy