
Market Snapshot
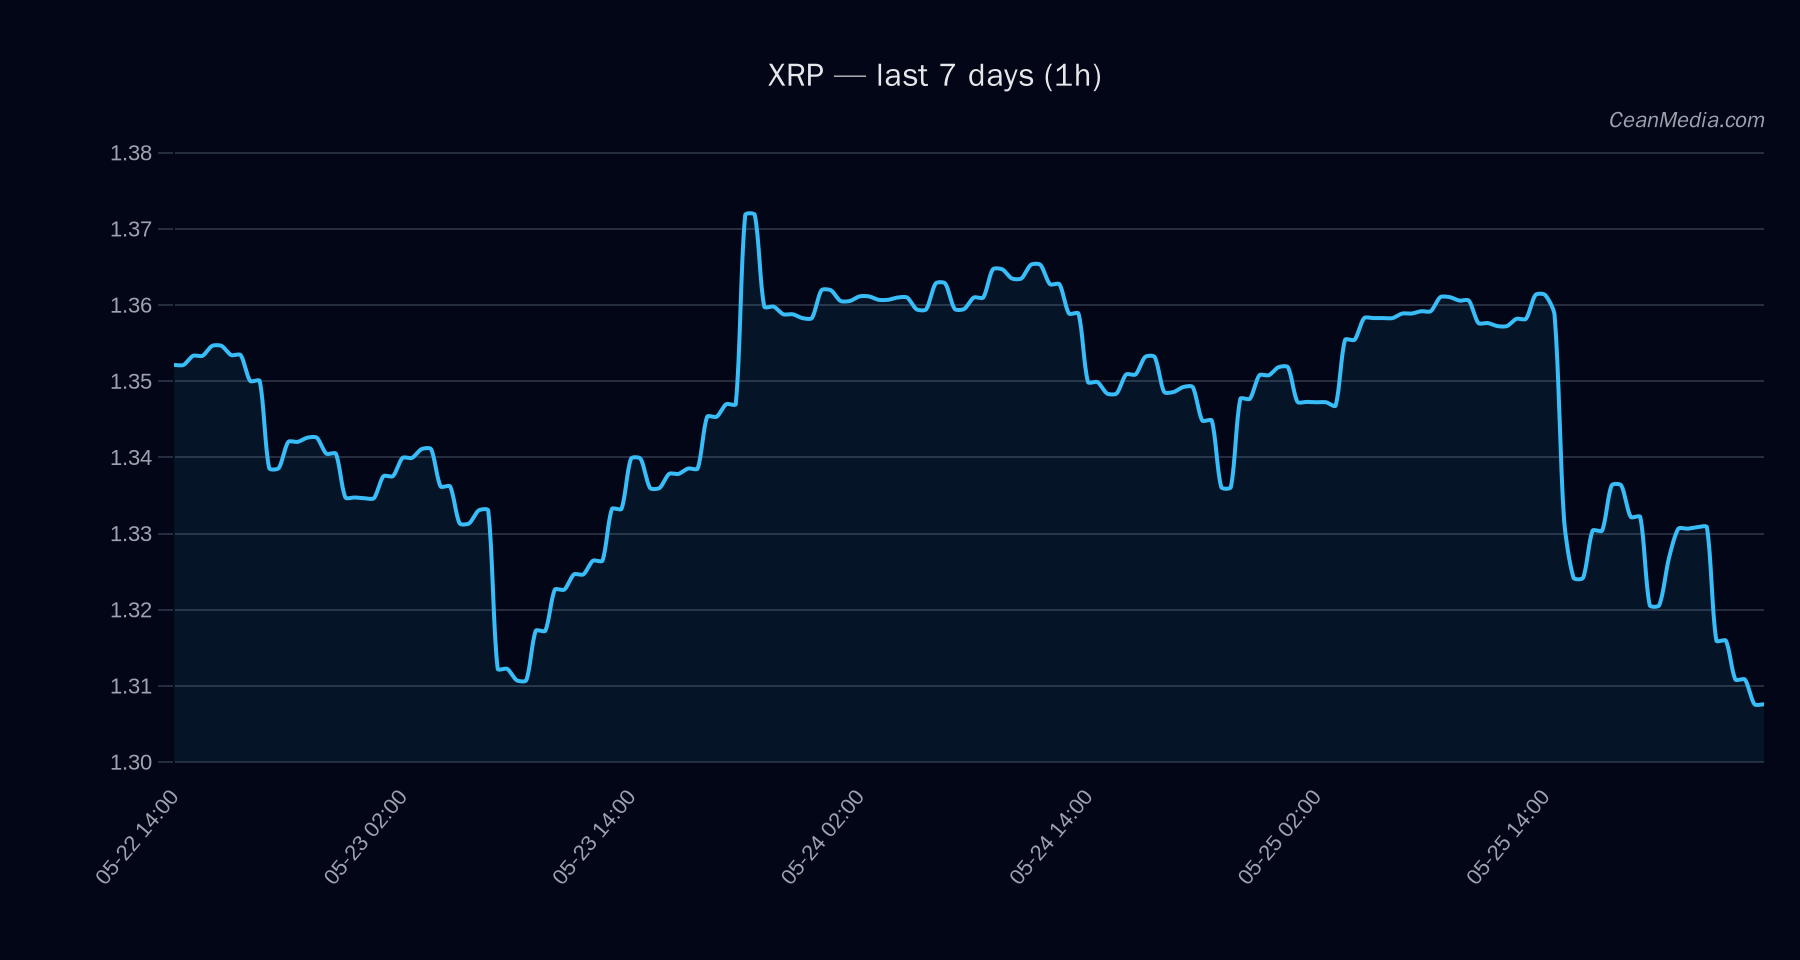
As of late May 2026, XRP is trading in a tight range with a bias described as mixed to bearish pressure and a low certainty (~19/100). The final composite view is cautious, signaling potential for both sides within current price action. The latest close sits at 1.3076 USD, and forecast range suggests modest upside potential but with notable resistance around 1.34 and support near 1.28.
Technical Analysis: XRP
- Current price: 1.3076
- Bias: mixed / bearish pressure; low certainty
- Composite score: -3.8 (conflicts: 3)
- Trend indicators: EMA12 < EMA26; SMA50 < SMA200; RSI at 29 (oversold); volatility sigma 24h 0.56%; very low volume regime
- Forecast: Up 53% probability in the model’s horizon, with Down 34% and Sideways 13%.
- Read: RSI oversold; price remains between key levels
- Support: near 1.28; Major support around 1.34
- Resistance: near 1.34; Major resistance around 1.44
- Trends & triggers
- Up trigger: 1h close > 1.34 (target: 1.3604 – 1.3871)
- Down trigger: 1h close < 1.28 (target: 1.2558 – 1.2302)
- Context: breadth 0% above SMA50; BTC correlation 0.91; overall market sentiment shows extreme fear (F&G 22); BTC dominance around 57.8%
Drivers
- Top drivers suggest a modest upward tilt from EMA slope and other micro-structure signals, but overall TA components indicate bearish sentiment remains intact.
- EMA Slope: -0.0025
- Funding Z-Score: +0.01
- Basis Z-Score: -0.93
- Order-book imbalance (EMA5): -0.1
- RV 7D: 0.02
- Volatility regime: very low
ETF Flows (BTC/ETH)
The ETF flow context provided covers BTC and ETH rather than XRP directly. Recent data show:
- BTC ETFs: +$629.8M 1D; +$198.4M 5D; +$585.2M 10D
- ETH ETFs: +$101.2M 1D; -$20.8M 5D; +$81.6M 10D
Interpretation: These flows suggest a current risk-on environment or at least appetite for large-cap crypto exposure in BTC/ETH space. The data is context and should not be used as a primary signal for XRP, but it provides backdrop for market sentiment and liquidity conditions that can influence cross-asset dynamics. The XRP narrative remains driven by its own technicals and on-chain dynamics rather than ETF flows in BTC/ETH.
What to Watch Next
- Watch for a close above 1.34 on an intraday basis to validate the upside trigger toward 1.3604–1.3871.
- Remain vigilant for a break below 1.28 to confirm a shift toward 1.2558–1.2302.
- Monitor breadth signals and BTC/ETH flow context as supportive or risk-off indicators for broader market direction.
- Keep an eye on RSI and volatility regime, given the current oversold condition and very low volatility which can precede follow-through moves.
Hashtags: #XRP #CryptoAnalysis #TechnicalAnalysis #ETFFlows #BTC #ETH #MarketSnapshot #PriceForecast #TradingStrategy #RiskManagement #CryptoMarket #Liquidity