Market Snapshot
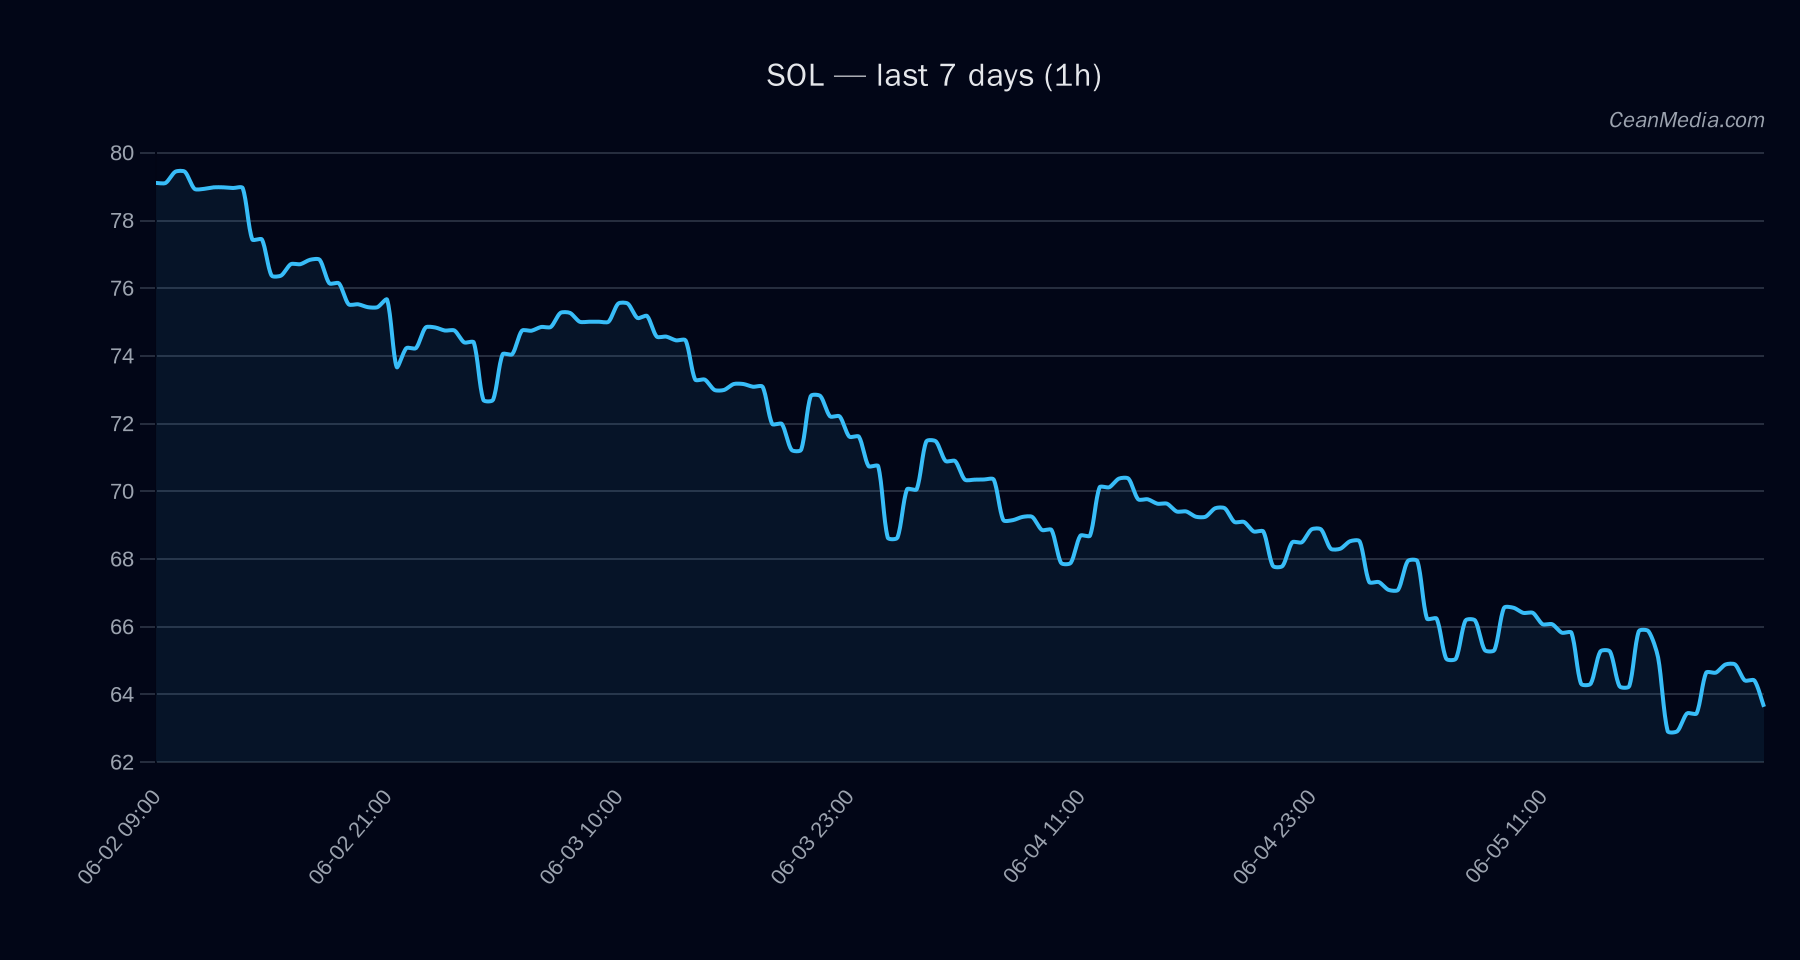
SOL trades around the mid-$60s after a bearish technical backdrop. The model indicates a down bias with high certainty, supported by trend indicators and volatility compression. ETF flow data are provided for BTC and ETH as a market context proxy; these ETF signals are optional context and should not be treated as primary drivers for SOL pricing.
Technical Analysis: SOL
- Bias: bearish with high conviction (95/100).
- Price: Close at 64.43 (as of the snapshot).
- Trend indicators: EMA12 < EMA26; SMA50 < SMA200; RSI 42; volatility regime: Low; recent σ24h 1.53%.
- Forecast and model: down, 75% probability; P50 range 61.40; P20-P80 54.39–76.43.
- Key levels: Support near 63.1 (major 63.1); Resistance near 65.7 (major 65.7). Break above 65.7 targets 67.03–68.35; Break below 63.1 targets 61.88–60.62.
- Triggers:
- Up trigger: 1h close > 65.7 → 67.033 / 68.3473
- Down trigger: 1h close < 63.1 → 61.8786 / 60.6157
- Invalidation note: No immediate breakout confirmation beyond current range; top-down drivers suggest caution until a breakout occurs.
Drivers
- RETURN 24H: -0.08%
- EMA SLOPE: -0.0029
- FUNDING Z-SCORE: -1.05
- BASIS Z-SCORE: -0.87
- ORDER-BOOK IMBALANCE (EMA5): 0.04
- BTC RETURN 24H: -0.04
- Macro/market context: Cross-market risk assets softer; Fear/Greed sentiment at extreme fear (12). BTC.D at 56.1% with slight intraday decline; overall breadth weak (0% above SMA50).
- Volatility: Low regime with ATR at 0.805; vol unit 1.0063; volatility indicators suggest muted intra-session ranges.
ETF Flows (BTC/ETH)
The ETF flow data provided cover BTC and ETH only. Net positive flows in both BTC and ETH ETFs over 1-day and longer horizons reflect a risk-on stance in broader markets. Importantly, these ETF signals are context and market backdrop rather than primary signals for SOL pricing. SOL-specific moves should be analyzed independently of BTC/ETH ETF flows.
- BTC ETF: +$629.8M (1D); +$198.4M (5D); +$585.2M (10D)
- ETH ETF: +$101.2M (1D); -$20.8M (5D); +$81.6M (10D)
What to Watch Next
- Monitor the 1h close relative to 63.1 and 65.7; a close above 65.7 would shift near-term bias according to the trigger levels.
- Watch for changes in volatility regime and RSI movement toward oversold/overbought boundaries for potential momentum shifts.
- Assess cross-asset risk signals (risk assets softness and extreme fear) for potential correlation effects with SOL.
- Stay aware of any new ETF flows data or macro updates that could alter risk appetite and liquidity conditions.
Hashtags: #SOL #cryptomarket #technicalanalysis #ETFflows #BTC #ETH #riskon #riskoff #tradingview #marketinsight #liquidity