Market Snapshot
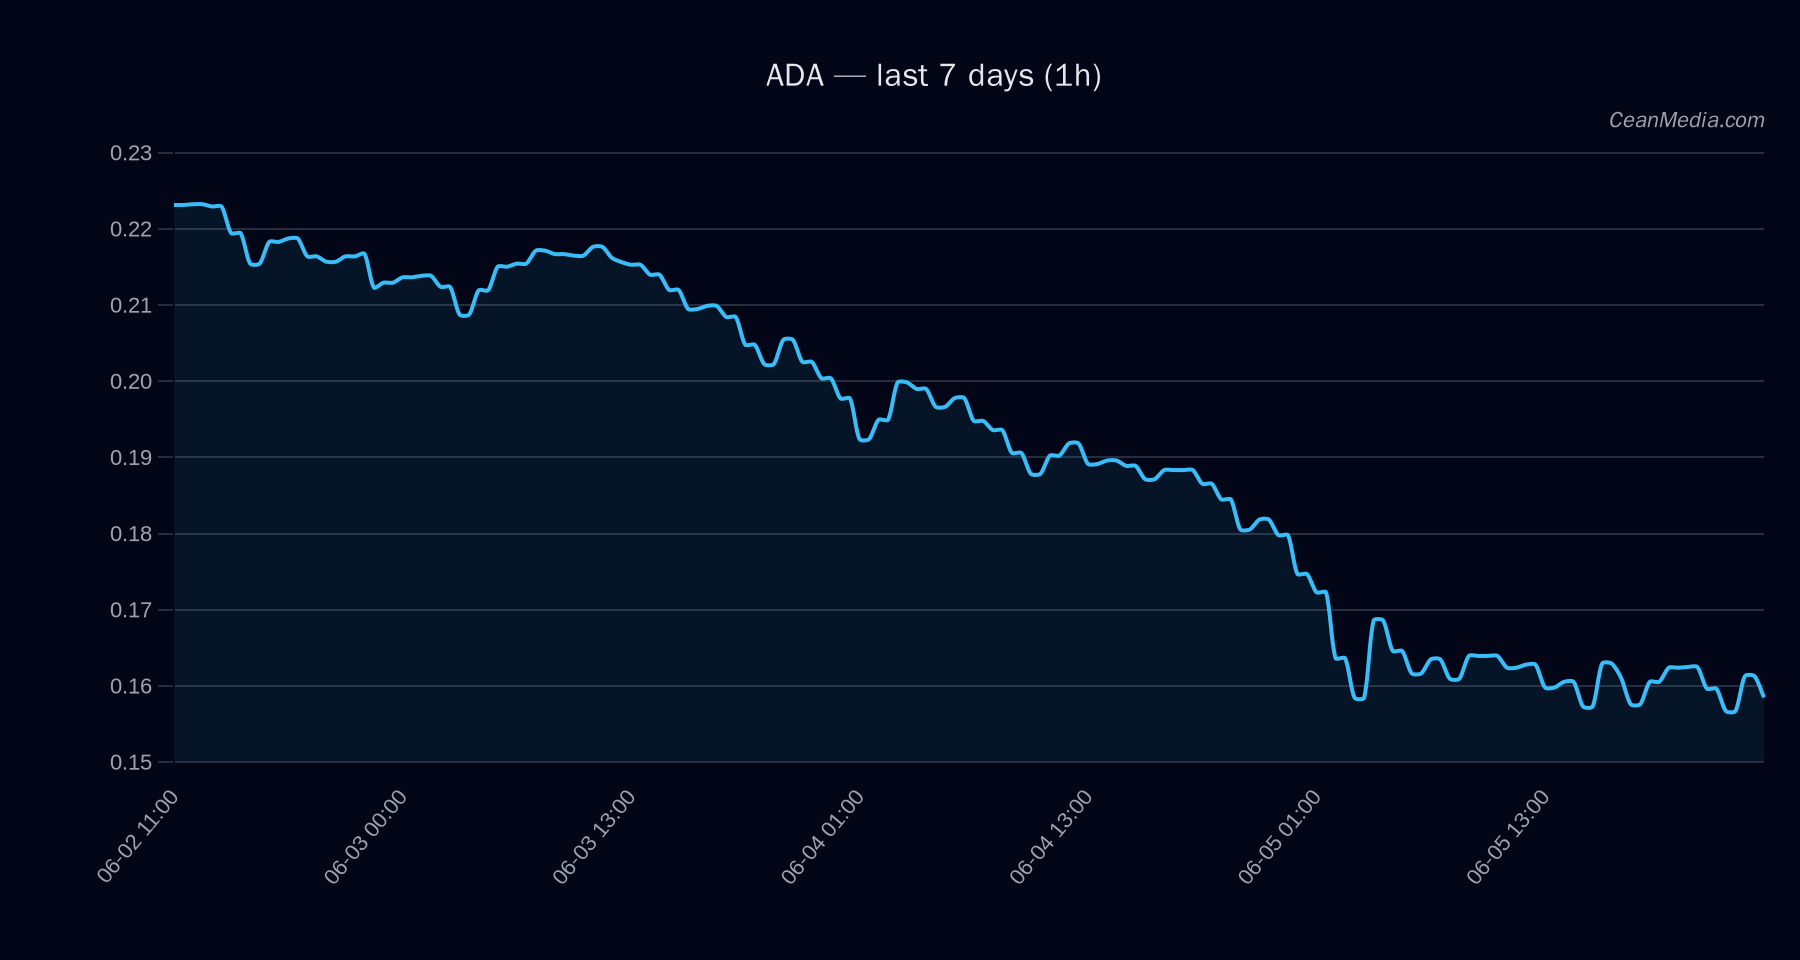
Asset: ADA | Price: 0.1577 USD (close). Market context shows a low volatility regime with breadth readings indicating limited participation above the 50-day average. Cross-asset risk signals remain muted to negative, with extreme fear on sentiment metrics. Overall directional bias remains bearish based on current TA and macro inputs.
Technical Analysis: ADA
- Bearish with high certainty (95/100).
- -7.9 (conflicts: 0).
- Trading between support near 0.155 and resistance near 0.16. Break above 0.16 targets 0.1641–0.1681; break below 0.155 targets 0.1515–0.1475.
- EMA12 < EMA26; SMA50 < SMA200; RSI 39 indicating downside momentum; volatility regime: Low (σ24h 2.43%).
- Model forecast down (82%); Probability distribution: up 8%, sideways 10%, down 82%.
- Support ~0.155; Major support near 0.16; Resistance ~0.16; Major resistance near 0.2.
- Up: close > 0.16 within 1h implies move to 0.1641–0.1681; Down: close < 0.155 implies move to 0.1515–0.1475.
- Inside-range setup with no breakout confirmation; macro/market backdrop remains risk-off biased in the near term.
Drivers
- Top model drivers indicate negative momentum with a strong tilt from market structure factors (SPREAD BP, BASIS Z-SCORE, FUNDING Z-SCORE).
- Momentum indicators show EMA slope and trend strength contributing to the downside bias.
- BTC dominance and cross-market risk assets direction align with risk-off sentiment, though BTC correlations suggest mixed implications for altcoins in the near term.
- Readouts show drawdown pressures over 30 days and a current distance-from-ma indicating mild deviation from key moving averages.
ETF Flows (BTC/ETH)
Contextual context: ETF flow data provided here relates to BTC and ETH ETFs only. These flows are not a primary signal for ADA, but they help frame the macro liquidity and risk-on/off environment that can influence altcoin performance.
- BTC ETF: +$629.8M (1D), +$198.4M (5D), +$585.2M (10D)
- ETH ETF: +$101.2M (1D), -$20.8M (5D), +$81.6M (10D)
Interpretation: The net positive ETF flows in BTC/ETH across the short to medium term suggest a risk-on backdrop for major assets in those markets. However, ADA-specific signals remain governed by its own technicals and microstructure. ETF data should be viewed as contextual rather than primary signals for ADA positioning.
What to Watch Next
- Watch for a close above 0.16 on a 1-hour candle as a near-term bullish trigger, with potential move toward 0.1641–0.1681 if sustained.
- Monitor for a break below 0.155 with close confirmation to assess downside targeting 0.1515–0.1475.
- Keep an eye on macro risk-off/risk-on shifts via BTC dominance and overall volatility regime, which can impact ADA liquidity and price action.
- Reassess once new data on market breadth and institutional flow solidifies beyond current extremes.
Hashtags: #ADA #CryptoAnalysis #Altcoins #TechnicalAnalysis #ETFFlows #BTC #ETH #MarketContext #PriceAction #RiskManagement #CryptoNews #MarketUpdate
Note: ETF data is included for context only and should not be treated as a primary signal for ADA trading decisions.