
Market Snapshot
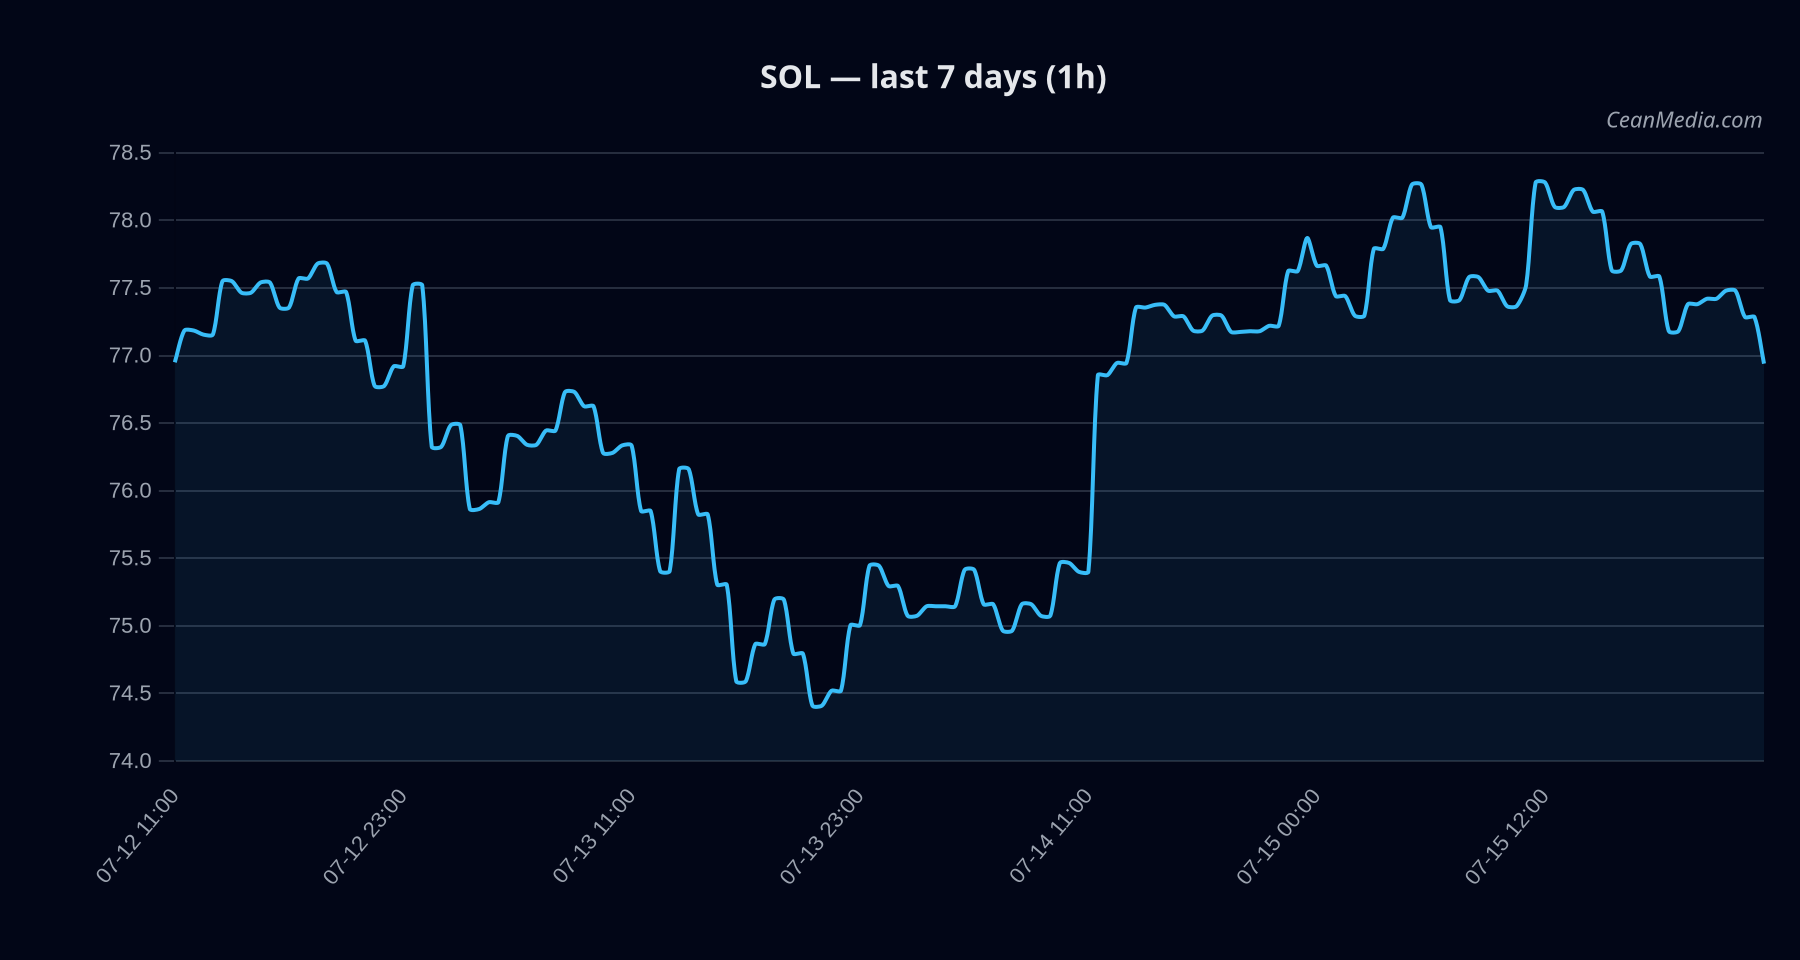
As of 2026-07-16, SOL trades around the mid-70s with a bias that is slightly bearish and a low to moderate confidence level. The composite score sits at -1.8 with dataCompleteness at 98%, and a snapshot age of 0.0 hours. Market breadth is positive with 83% of assets above their 50-day moving average, while BTC dominance has trended higher over the past week, contributing to a risk-off tilt in some segments.
Technical Analysis: SOL
- Price: Close at 76.8.
- Bias: Slightly bearish; certainty 26/100.
- Forecast Range: P50 75.91; P20-P80 72.95–81.29.
- Model Direction: Sideways, with a 8% probability of a bullish move; Downward pressure at 46% likelihood.
- Technical Trend: Sideways. RSI 41 indicating neutral momentum. EMA12>EMA26 and SMA50
- Key Levels:
- Support near 75.3
- Major support near 74.8
- Resistance near 78.3
- Major resistance near 80.7
- Triggers:
- Up: 1h close > 78.3 → potential targets 79.90–81.47
- Down: 1h close < 75.3 → potential targets 73.76–72.25
- Invalidation: Breakouts beyond the defined trigger levels would require re-evaluation of the model forecast and a renegotiation of the bias with updated data.
- Key Levels:
Drivers
: - BTC DOMINANCE: -0.37 contribution; BTC dominance index at 56.2%
- STOCK AAPL RET 1D: +0.35 contribution
- TBI EMA10: -0.32
- GOLD/SILVER RATIO Z-SCORE: +0.29
- LIQ IMB EMA12: +0.26
- DEPTH Z-SCORE: -0.25
: Market context shows Very Low volatility, with breadth strong on the upside but overall risk sentiment weighted by BTC dominance. The 72h BTC/ SOL correlation is high (0.89), indicating close cross-asset interaction during this period.
ETF Flows (BTC/ETH)
Contextual note: ETF flow data provided here reflects BTC and ETH ETFs only and should be treated as a secondary context for SOL analysis. These flows are not primary signals for SOL pricing but help frame macro risk posture. BTC ETFs show persistent outflows over 1D and 5D horizons, with 1D at -$424.7M and 5D at -$570.2M, implying a cautious risk-off tilt in BTC-linked products. ETH ETF flows are also negative but smaller in magnitude (-$15.4M 1D, -$6.3M 5D, -$210.7M 10D).
What to Watch Next
- Watch for a close above 78.3 to validate the upside trigger targeting 79.9–81.5.
- Monitor a break below 75.3 for potential moves toward 73.8–72.3.
- Assess changing volatility regime if vol returns to higher levels, which could invalidate the current sideways bias.
- Keep an eye on BTC dominance shifts and major equity risk assets beta, as those factors tend to influence cross-asset flows and SOL correlations.
Hashtags: #SOL analysis #crypto markets #solanalysis #btcdom #etfflows #riskmanagement #technicalanalysis #tradingstrategies #marketcontext #soltrends #crypto2026 #marketwatch
Note: This article integrates SOL’s direct technicals with ETF flows context to provide a broader risk framework. The ETF data is provided for context only and should not be treated as SOL-specific signals.