
Market Snapshot
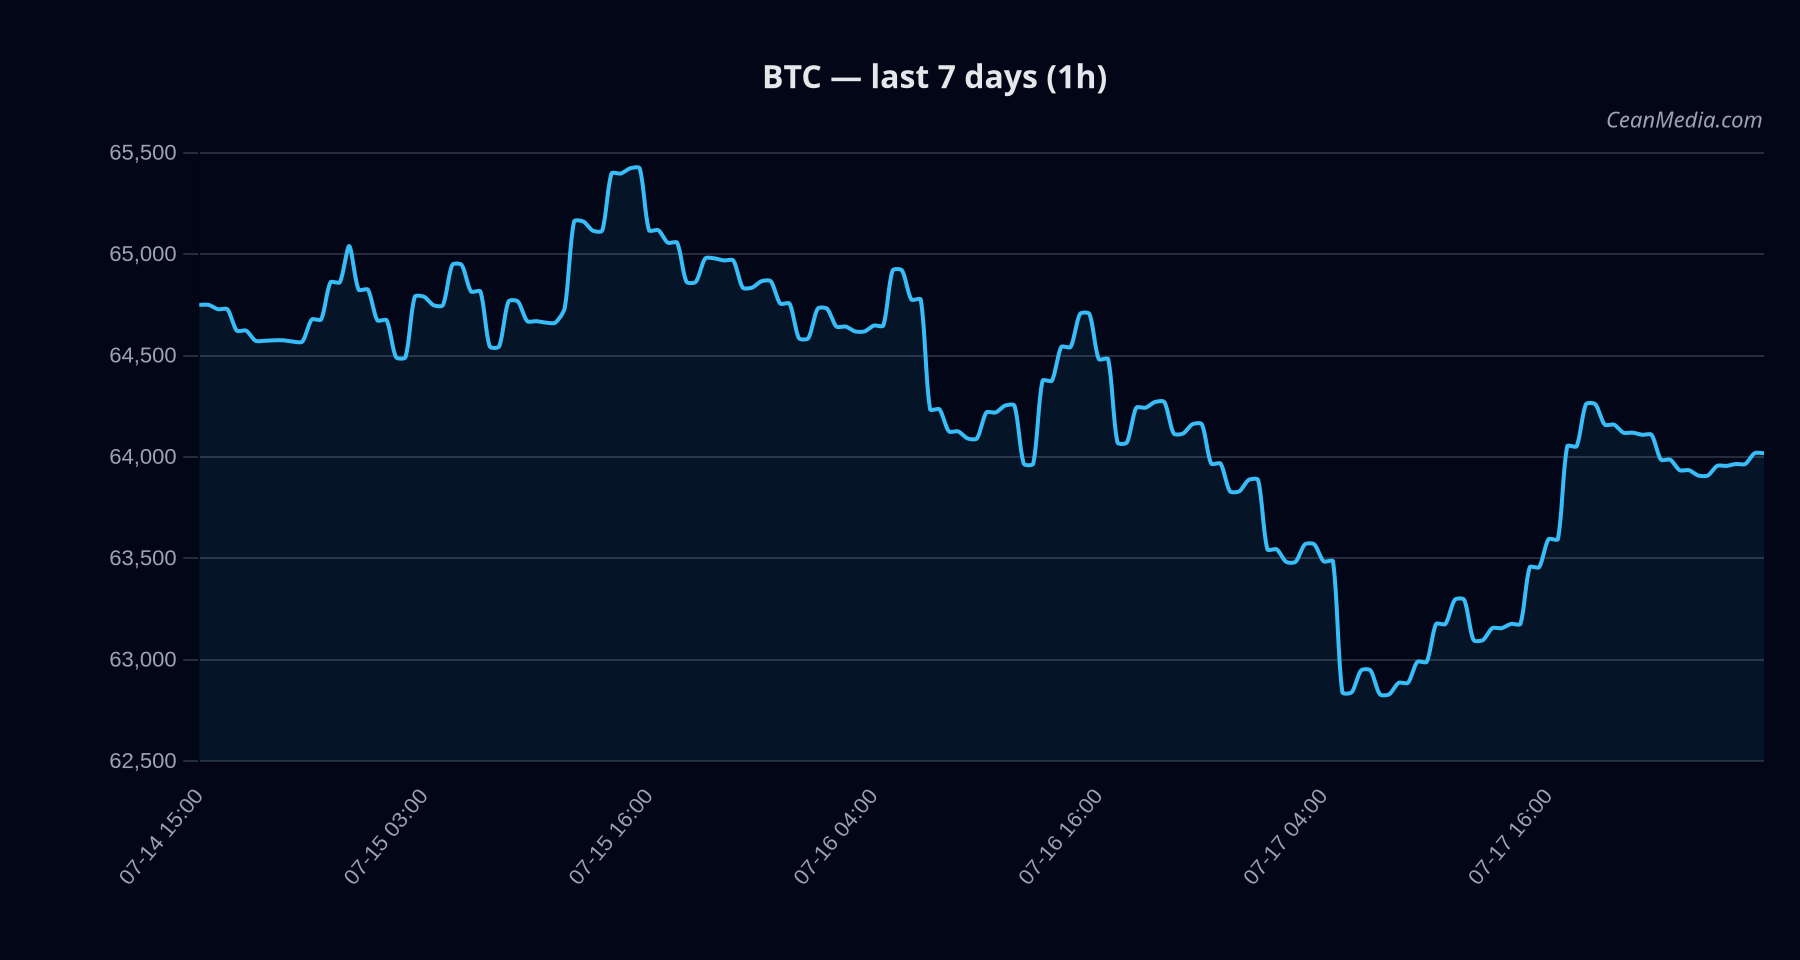
Bitcoin (BTC) is trading in a narrow range near $63,958 with a sideways forecast and a mixed bias. The immediate market context shows very low volatility, mild risk-off sentiment across equities, and a market breadth signal of 33% above the 50-hour moving average. ETF flows show BTC-focused positioning shifting modestly, while ETH remains in negative flow territory. These dynamics provide context but should not be treated as primary drivers for BTC price action.
Technical Analysis: BTC
- mixed/neutral with low certainty (8/100).
- Price: Close around 63,958; within a defined band with interim support at 62,675 and major support near 61,700; resistance near 65,225 and major resistance at 64,550.
- Trend indicators: EMA12>EMA26, SMA50>SMA200, RSI 55; volatility regime described as very low (σ24h 0.31%).
- Forecast range: P50 at 64,232.84; P20-P80 from 60,259.33 to 66,277.57.
- Forecast direction: sideways with a probability of roughly 11% (model forecast); probabilities indicate slight tilt toward up or down but largely balanced (up ~45.5%, sideways ~10.6%, down ~43.9%).
- Triggers:
- Up trigger: 1h close > 65,225 -> potential path to 66,541.90 and 67,846.65.
- Down trigger: 1h close < 62,675 -> potential path to 61,425.26 and 60,171.69.
- Invalidation: Losses below major support (61,700) or a clear close above major resistance (64,550) would recalibrate the stance; however, current readings keep the bias mixed with a bullish-leaning TA overlay due to EMA/SMA posture and RSI.
Support / Resistance (Key Levels)
- Support: 62,675 (near), 61,700 (major)
- Resistance: 65,225 (near), 64,550 (major)
Read of Market Structure
BTC sits between defined support and resistance. The trend indicators point to a bullish tilt on structural momentum (EMA cross, rising trend slope), yet the price remains within a range consistent with sideways posture. RSI at 55 indicates neutral momentum.
Drivers
- Stable MCAP log1p (negative contribution), FNG Z-score (positive), NASDAQ100 1D return (negative), VOL of VOL (positive), RV 7D (negative), SP500 5D return (positive).
- Very low vol regime, ATR around 108.61, vol unit 255.832; breadth is modest (33% above SMA50).
- Long positioning shows crowding (1.25x); order-book imbalance (EMA5) slight positive pressure; funding z-score negative, indicating a mild risk-off tilt in funding dynamics.
ETF Flows (BTC/ETH)
Contextual ETF data is provided for BTC and ETH only and is to be interpreted as supplementary context rather than a primary signal for BTC price action. BTC ETFs show a one-day inflow, with five-day and ten-day totals negative, suggesting modest risk-off bias over a multi-day horizon. ETH ETF data shows outflows on the 1D metric, with modest longer-horizon inflows, signaling differential flow dynamics between BTC and ETH.
- BTC ETF: +$15.0M today; -$324.2M (5D); -$1.65B (10D).
- ETH ETF: -$16.8M today; +$6.8M (5D); -$214.7M (10D).
Interpretation: The BTC ETF activity indicates a modest near-term inflow that may reflect cautious positioning. ETH flows point to outflows on the short horizon, which can influence correlational dynamics but should not be treated as a primary BTC signal. Overall, ETF data provides a backdrop that complements price and traditional market indicators.
What to Watch Next
- Monitor 1h closes around 65,225 for breakout confirmation toward higher targets.
- Watch for a break below 62,675 to trigger subsequent support levels near 61,700 and 60,171.
- Observe ETF flow momentum in BTC/ETH as a contextual but non-primary signal for risk appetite shifts.
- Keep an eye on volatility regime and breadth a↔s an early cue for regime change.
Hashtags: #Bitcoin #BTCAnalysis #TechnicalAnalysis #ETFFlows #MarketSnapshot #CryptoMarkets #BTCUSD #cryptoNews #TradingStrategy #Liquidity #Volatility #MarketContext