Market Snapshot
Bitcoin (BTC) remains within a defined support and resistance zone, with current levels at approximately $86,750 and $90,275 respectively. The market exhibits very low volatility with a slight bullish bias, supported by technical indicators and recent price action. ETF flows for BTC and ETH continue to reflect significant outflows, indicating a cautious risk environment.
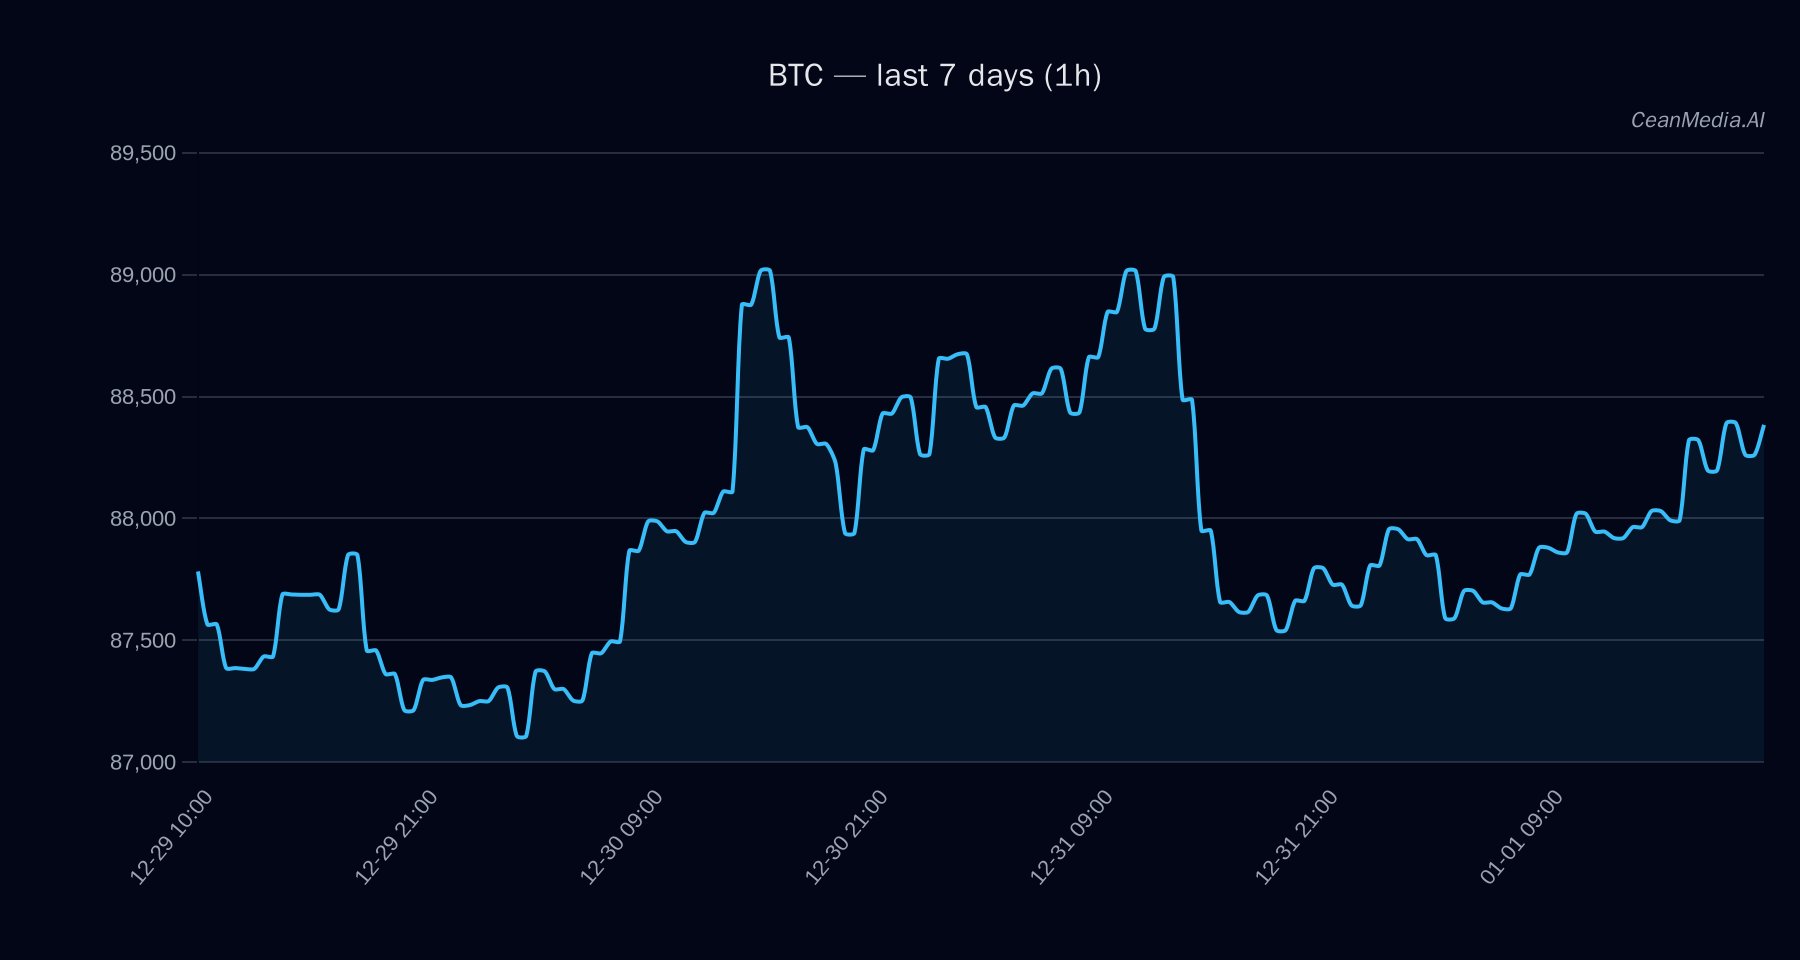
Technical Analysis: BTC
The current price of BTC is around $88,509, positioned between key support at $86,750 and resistance at $90,275. A break above resistance could target levels near $92,085 to $93,890, while a breakdown below support might see prices decline to $85,004 or lower to approximately $83,269. The technical setup shows bullish signals, with EMA12 above EMA26, SMA50 above SMA200, and RSI at 62, suggesting neutral to slightly bullish momentum. The short-term forecast indicates a 47% probability of downward movement, with the market currently not showing strong directional momentum.
Drivers
- Return over 24H: +0.56%
- EMA Slope: Slight positive (+0.0001), indicating minimal upward trend acceleration
- Funding Z-Score: -1.11, suggesting slight bearish sentiment in funding rates
- Order Book Imbalance (EMA5): 0.27, showing modest buying pressure
- BTC 24H Return: +0.56%
- Trend Strength: 1.03, indicating a stable but cautious bullish trend
Overall, momentum remains modest with very low volatility, and the market exhibits a neutral stance with slight bullish undertones.
ETF Flows (BTC/ETH)
Recent ETF data shows significant outflows: BTC ETFs have seen a decline of $85.4 million in one day, with a total of $423.1 million over five days. ETH ETFs have also experienced outflows, totaling $34.2 million in one day and $71.1 million over five days. These flows suggest a risk-off environment with investors reducing exposure to crypto ETFs, which may influence broader market sentiment. However, it is important to note that ETF flows are only relevant to BTC and ETH and should be considered as context rather than primary trading signals for BTC.
What to Watch Next
- Monitor for a break above $90,275 resistance for potential bullish continuation
- Watch for a breakdown below $86,750 support to confirm further downside
- Keep an eye on ETF outflows and market risk sentiment for broader implications
- Observe changes in momentum indicators and volatility regimes for early signals
Hashtags: #Bitcoin #CryptoAnalysis #MarketUpdate #BTC #ETFs #TradingSignals #CryptoNews #TechnicalAnalysis #CryptoFlows #MarketSentiment #RiskOff