Market Snapshot
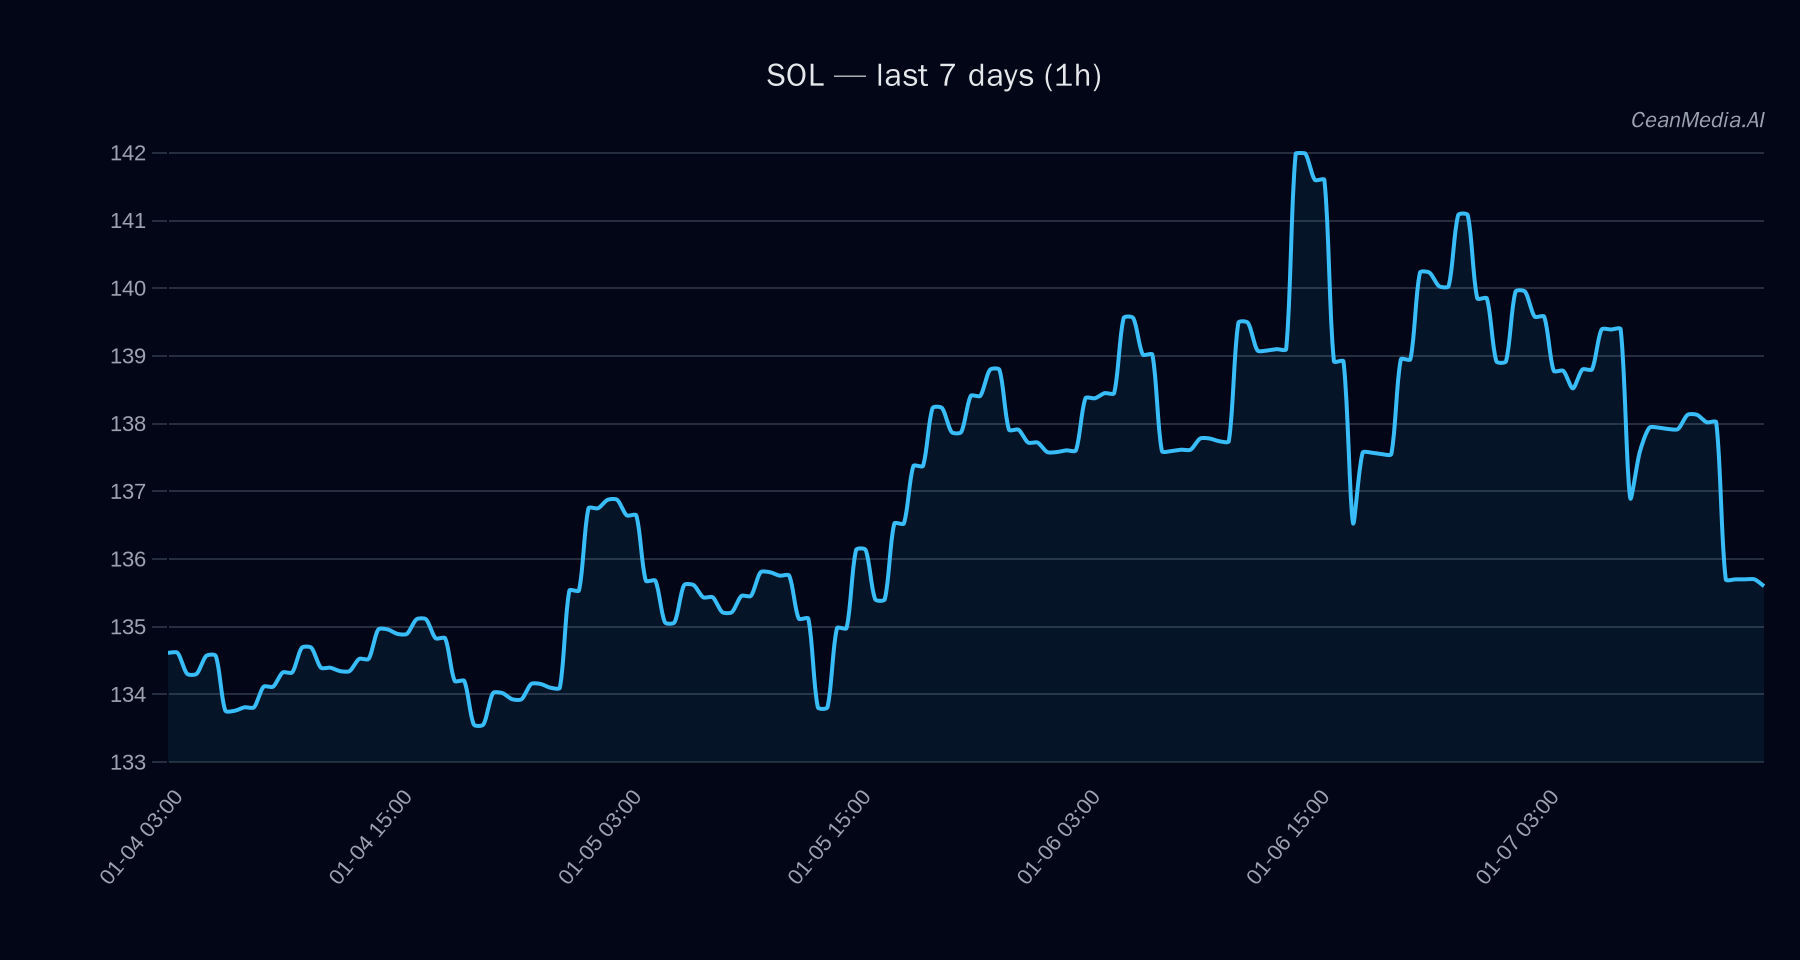
As of January 7, 2026, Solana (SOL) is trading around $135.22 amidst a subdued volatility environment with very low trading volume. The broader crypto market exhibits a cautious sentiment, reflected in modest returns over the past 24 hours and a slight decline in Bitcoin and Ethereum ETF flows. The market context suggests a sideways bias with key support and resistance levels defining potential short-term moves.
Technical Analysis: SOL
- Levels: Support at approximately $133 (near support), resistance at $138 (near resistance). A break above $138 could push SOL towards $140.68–$143.44; a break below $133 could see a decline towards $129.87–$127.22.
- Bias: Neutral to sideways, with a 48% probability for upward movement in the next 24 hours. The current EMA and SMA configurations indicate a consolidation phase, with EMA12
SMA200. - Triggers: A close above $138 for a bullish breakout, or below $133 for a bearish move.
- Invalidation: Failure to sustain above resistance or below support levels may lead to continued sideways trading.
Drivers
- Top Factors: The 24-hour return is marginally negative at -0.03%, with a negative EMA slope (-0.0015) indicating slight bearish momentum.
- Market Sentiment: Funding Z-Score (-3.64) and Basis Z-Score (-2.09) suggest subdued funding rates and basis deviations, aligning with low volatility and low trading activity.
- Momentum and Volatility: BTC 24-hour return is slightly negative (-0.02%), with BTC trend strength at 1.22, indicating some correlation but no strong directional bias. Overall, volatility remains very low.
ETF Flows (BTC/ETH)
Current ETF flow data shows a mixed picture: Bitcoin ETFs have experienced a net outflow of approximately $243.2M over one day but a cumulative inflow of $710M over five days, indicating some short-term risk-off sentiment. Conversely, Ethereum ETFs have seen consistent inflows, totaling around $113.1M daily, $447.8M over five days, and $335.8M over ten days, suggesting a slightly risk-on environment for ETH. While these flows provide context for overall market sentiment, they are not primary signals for SOL but can influence investor risk appetite.
What to Watch Next
- Monitor SOL’s price action around the key support at $133 and resistance at $138 for potential breakout signals.
- Observe broader market sentiment shifts, especially in Bitcoin and Ethereum ETF flows, for signs of risk-on or risk-off behavior.
- Keep an eye on volume and volatility indicators for signs of increasing market activity that could trigger directional moves.
- Watch for any macroeconomic developments or crypto-specific news that could impact investor sentiment and liquidity.
Hashtags: #Solana #CryptoAnalysis #MarketUpdate #Bitcoin #Ethereum #ETFFlows #TechnicalAnalysis #CryptoNews #DigitalAssets #Blockchain #Altcoins