Market Snapshot
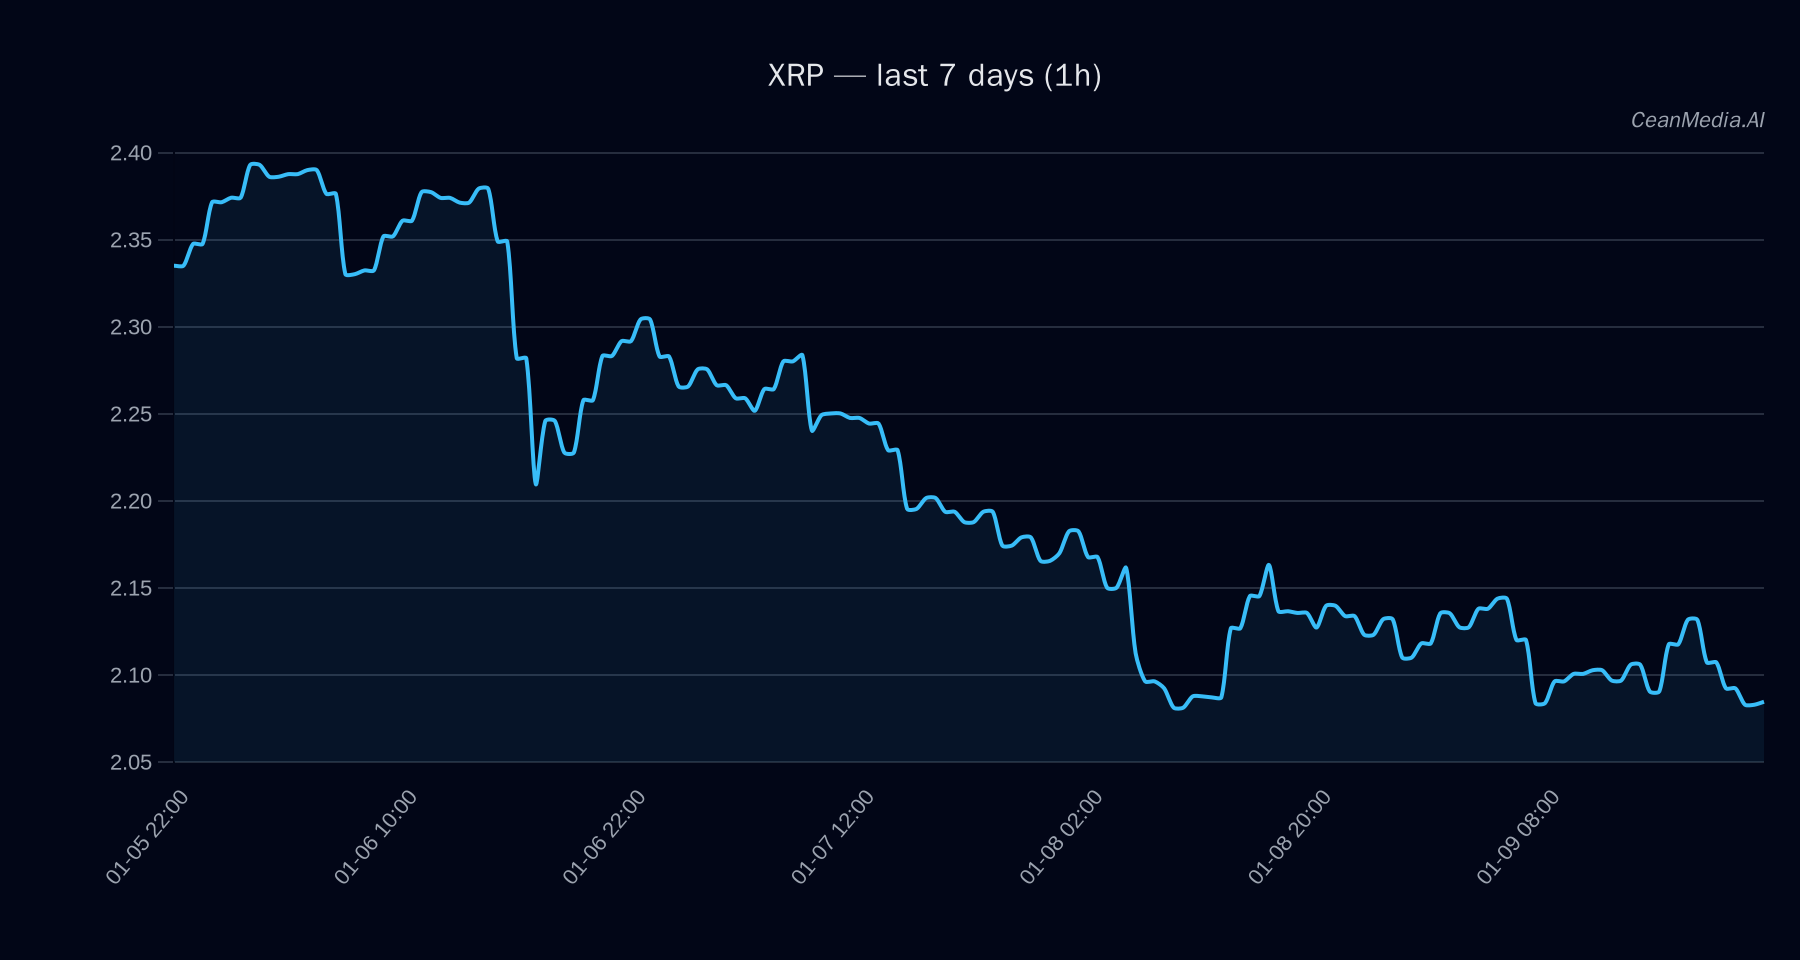
As of January 10, 2026, XRP is trading around the $2.08 level, with recent technical signals indicating sideways movement. The broader market continues to see mixed ETF flows, primarily in BTC and ETH, providing additional context for risk sentiment among traders and investors.
Technical Analysis: XRP
XRP currently sits between key support at approximately $2.04 and resistance at about $2.12. A break above the resistance zone (>$2.12) could propel the price towards $2.17–$2.21, while a breakdown below support (<$2.04) risks a decline towards $1.96–$2.00. The short-term forecast suggests a 50% chance of a downward move, with technical indicators such as EMA12
Drivers
- Return over 24 hours: Slight decline of -0.02%
- EMA slope: Slight negative slope (-0.0015), indicating minimal downward momentum
- Funding Z-Score: -0.4, suggesting neutral funding sentiment
- Basis Z-Score: -1.15, reflecting modest negative basis pressure
- Order Book Imbalance (EMA5): Slight positive imbalance (0.0028)
- BTC 24H Return: Slight decrease (-0.0069%)
- Market Volatility Regime: Very low, indicating limited price swings
The overall momentum remains subdued, with no strong directional drivers currently dominating the market.
ETF Flows (BTC/ETH)
Recent ETF data shows a notable outflow in Bitcoin ETFs over the past day (-$398.8M), although there has been a modest inflow over the past 5 days (+$40.4M). Ethereum ETFs have experienced a daily outflow (-$159.2M) but have seen positive flows over 5 and 10 days (+$198.1M and +$89.2M respectively). These flows suggest a cautious risk-on/off sentiment in the broader crypto market, with some investors rotating out of Bitcoin in favor of Ethereum. It is important to note that this ETF data is only for BTC and ETH and should be viewed as contextual rather than a primary signal for XRP.
What to Watch Next
- Monitor the $2.12 resistance level for potential bullish breakout signals
- Watch for a break below $2.04 to confirm further downside momentum
- Keep an eye on broader market ETF flows, especially in BTC and ETH, for risk sentiment cues
- Observe any changes in technical momentum indicators for early signs of trend shifts
Hashtags: #XRP #CryptoAnalysis #MarketUpdate #TechnicalAnalysis #ETFFlows #Bitcoin #Ethereum #CryptoMarket #TradingSignals #RiskSentiment #CryptoNews