Market Snapshot
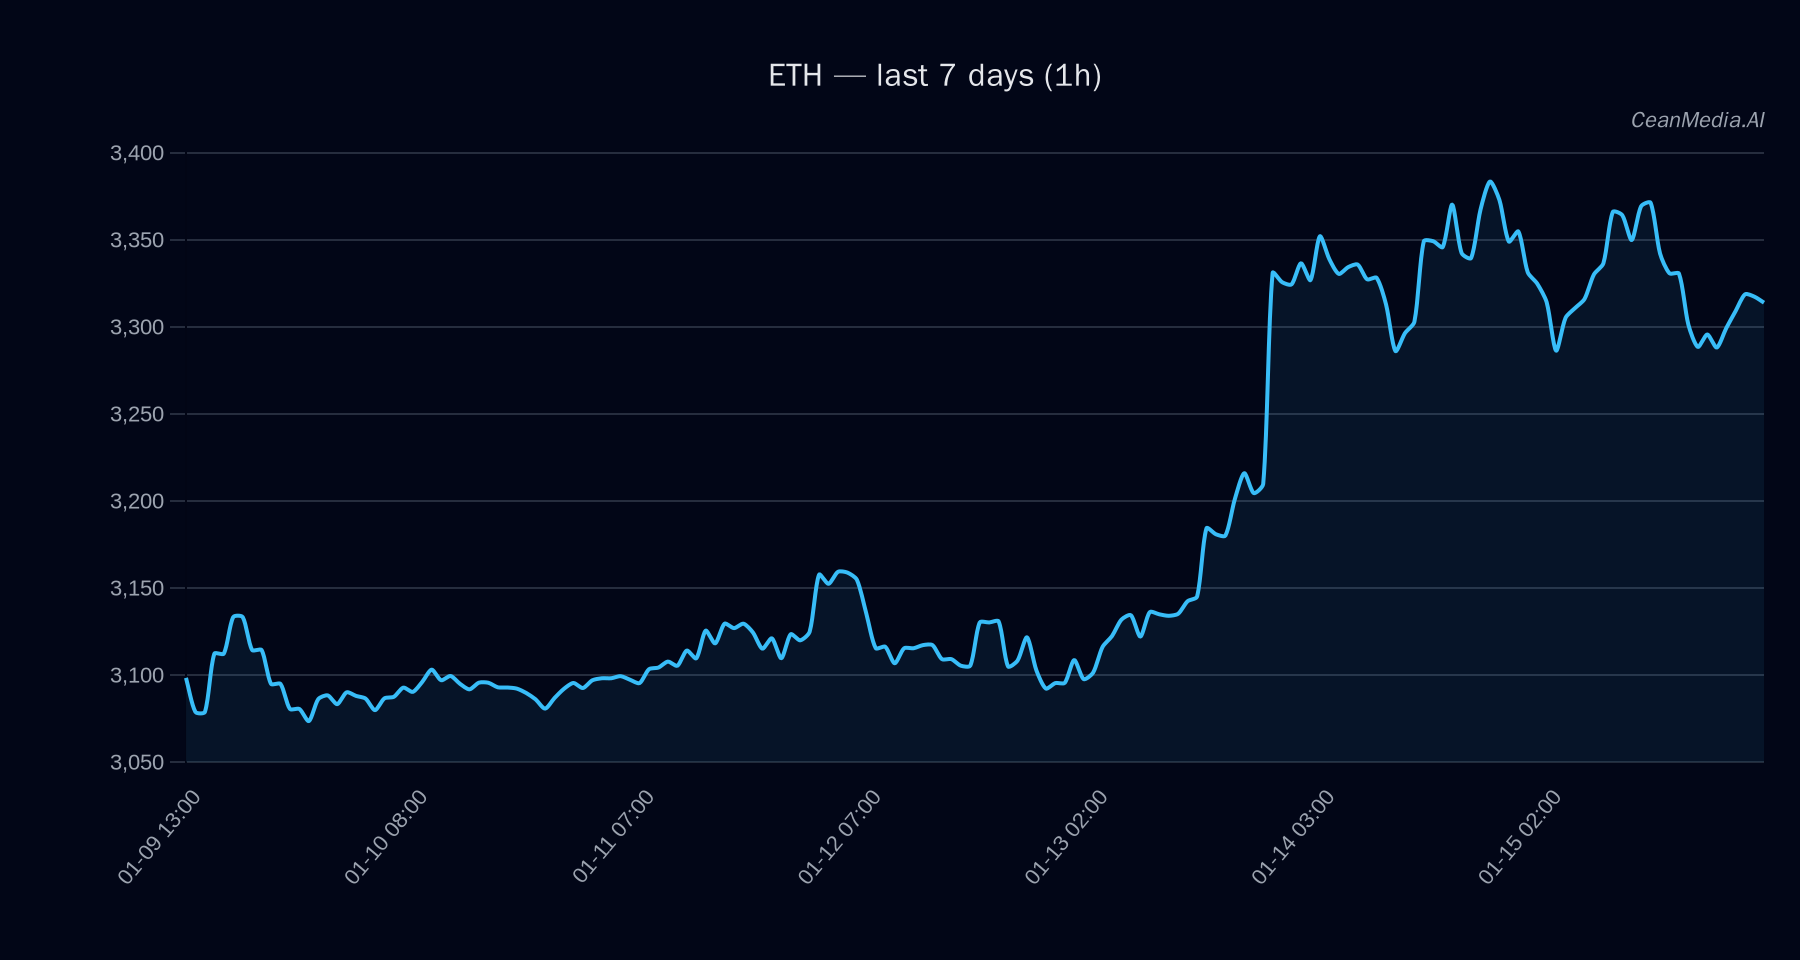
Ethereum (ETH) is currently trading around $3,301, with a sideways bias indicated by technical signals. The market exhibits very low volatility, and recent momentum remains neutral. ETF flows show mixed signals between Bitcoin and Ethereum, highlighting a cautious risk environment.
Technical Analysis: ETH
- Key Levels: Support at approximately $3,236; Resistance at approximately $3,368. Break above resistance suggests potential upside toward $3,434–$3,502. Conversely, a break below support points to downside targets near $3,171–$3,106.
- Bias: Sideways with a slight tilt towards upward movement if resistance is broken.
- Triggers: A close above $3,368 could accelerate gains to around $3,434–$3,502. A close below $3,236 may lead to declines toward $3,171–$3,106.
- Invalidation: Failure to hold support at $3,236 or resistance at $3,368 could prolong sideways trading.
Overall, the technical indicators (EMA12
Drivers
- Top Factors: 24-hour return near zero (-0.33%), funding Z-score (-0.47), ETF flow over 60 days (0.93), and a slight positive BTC dominance trend (+0.5% over 7 days).
- Momentum & Volatility: Trend strength remains modest, with very low volatility regime indicating subdued trading activity. The spread Z-score and order book imbalance suggest limited market pressures currently.
ETF Flows (BTC/ETH)
Recent ETF flow data shows a divergence: Bitcoin ETFs have experienced inflows over the past 10 days (+$378.7M), indicating increased risk appetite in Bitcoin. Ethereum ETF flows have been mixed, with a recent outflow (-$82.7M over 5 days), suggesting caution among ETH investors. These flows are only context and should not be solely relied upon for ETH trading decisions.
What to Watch Next
- Monitor if ETH breaks above the resistance at $3,368 for confirmation of an upward move.
- Watch for a decisive move below support at $3,236 for potential downside acceleration.
- Keep an eye on Bitcoin ETF inflows as a broader risk-on indicator, which may influence ETH sentiment.
- Observe changes in volatility and volume regimes for signs of increased market activity.
Note: ETF flows are only available for BTC and ETH and are provided for contextual understanding rather than primary trading signals.
Hashtags: #Ethereum #CryptoAnalysis #ETH #MarketUpdate #CryptoTrading #Bitcoin #ETFFlows #TechnicalAnalysis #CryptoMarkets #RiskOn #CryptoTrends #BlockchainInvesting