Market Snapshot
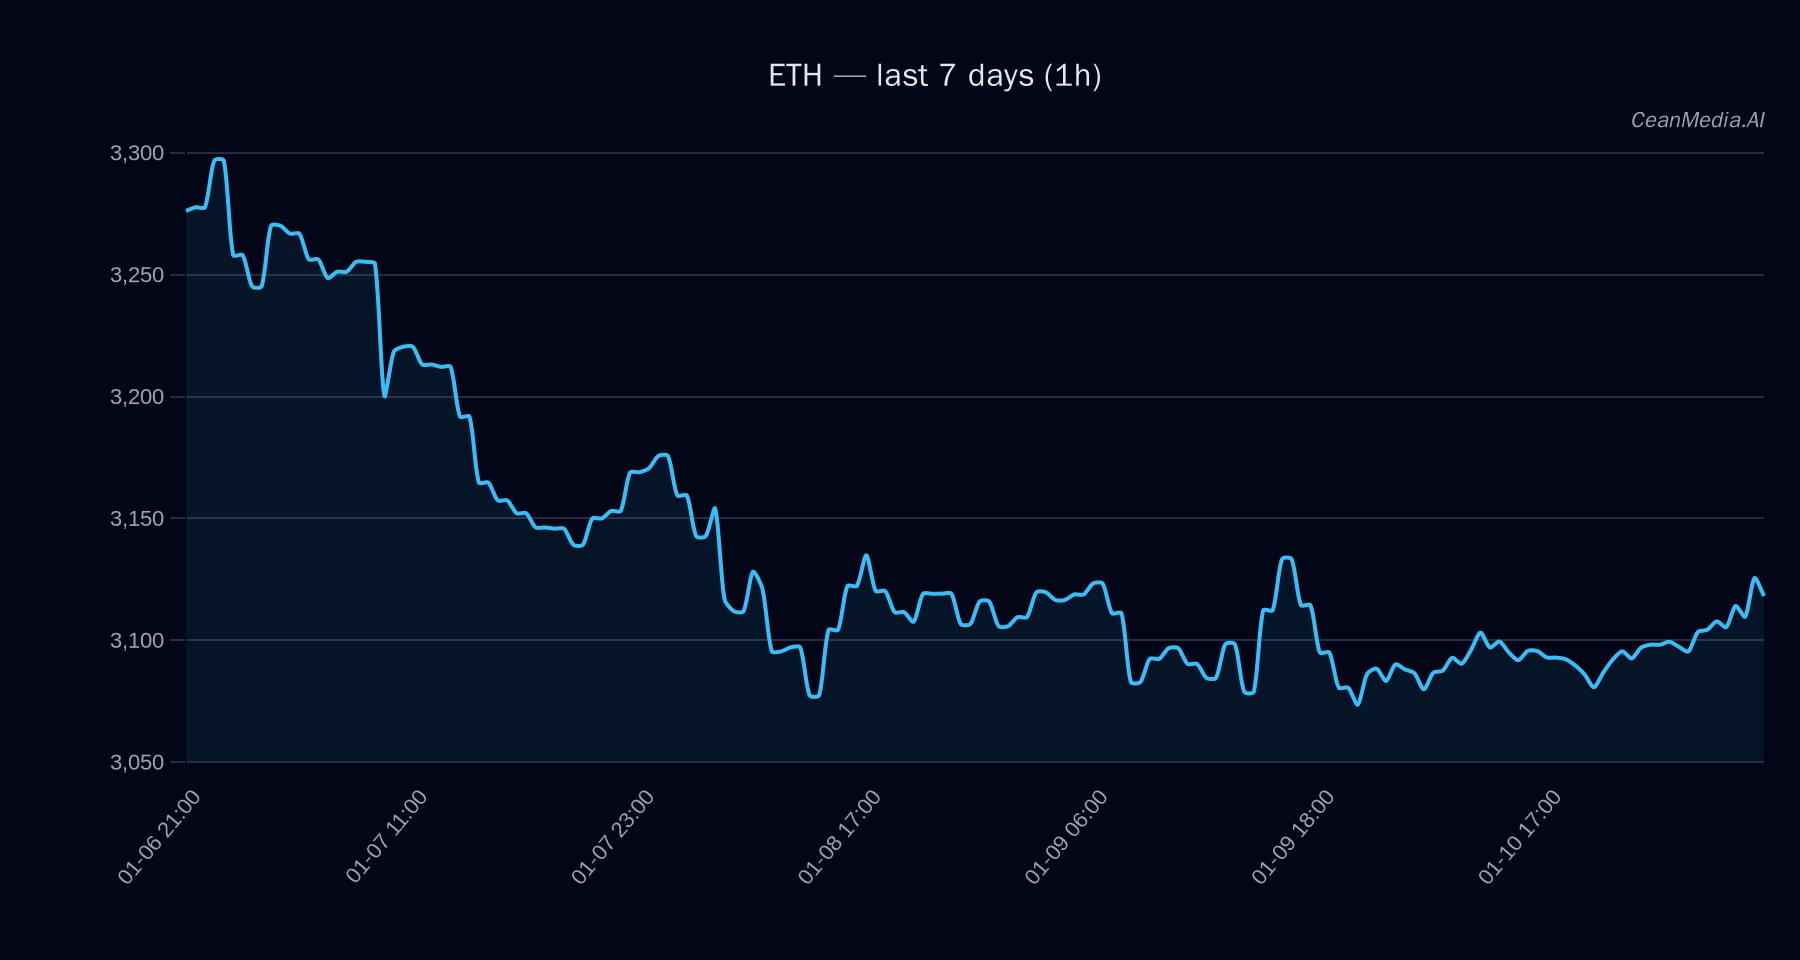
As of January 11, 2026, Ethereum (ETH) is trading around $3,119, with a short-term bias leaning towards a potential decline. The current technical conditions suggest sideways movement within a defined range, with support near $3,056 and resistance close to $3,182. Recent ETF flows indicate significant outflows from Bitcoin ETFs over the past week, while ETH ETFs have experienced modest inflows, providing a nuanced context for market sentiment.
Technical Analysis: ETH
- Levels: Support at approximately $3,056; Resistance at about $3,182. Break above resistance could push ETH towards $3,245–$3,309. A break below support may see ETH decline to $2,935–$2,995.
- Bias: Sideways with a slight downward tilt; short-term forecast indicates a 48% probability of decline.
- Triggers: A close above $3,182 would suggest a bullish move towards the upper target range; a close below $3,056 signals potential downside momentum.
- Invalidation: Break below $3,056 invalidates bullish scenarios, confirming a potential move toward lower levels.
The technical indicators show EMA12 above EMA26, SMA50 below SMA200, and RSI at 63, indicating a neutral to slightly cautious stance. Volatility remains very low, supporting the sideways outlook.
Drivers
- Top Factors: Return over 24 hours is minimal at 0.01%, with EMA slope indicating slight positive momentum. Funding and basis Z-scores remain modest, reflecting balanced market sentiment.
- Momentum and Volatility: The trend strength is moderate at approximately 1.39, while volatility regimes are very low, supporting the sideways technical picture. ETF flow Z-score over 60 days is negative at -1.34, indicating sustained outflows from Bitcoin ETFs, contrasting with modest inflows into ETH ETFs.
ETF Flows (BTC/ETH)
Recent ETF data shows a significant outflow from Bitcoin ETFs, with a 1-day decline of $250 million and a 5-day total of nearly $681 million. Conversely, ETH ETFs have experienced modest inflows over the past 10 days, totaling approximately $48 million. This divergence suggests a shift in risk-on/off sentiment, with investors potentially rotating away from Bitcoin in favor of Ethereum, although ETF flows alone should not be considered primary signals for ETH’s direction.
What to Watch Next
- Monitor whether ETH can break above the resistance at $3,182 to confirm bullish momentum.
- Watch for a close below support at $3,056, which could accelerate downside movement toward $2,935–$2,995.
- Keep an eye on broader market sentiment and macroeconomic factors that may influence ETF flows and overall risk appetite.
- Observe the continued ETF flow trends, especially the divergence between Bitcoin and Ethereum, for potential shifts in investor behavior.
Hashtags: #Ethereum #CryptoAnalysis #MarketUpdate #ETFs #CryptoTrends #TechnicalAnalysis #CryptoNews #Blockchain #Investing #DigitalAssets #CryptoMarkets #ETH